Table of Contents #
- What is VWAP
- The Formula (simplified)
- Why VWAP Matters to Institutions
- How to Read VWAP on a Chart
- VWAP as Dynamic Support and Resistance
- VWAP Bands (Standard Deviation)
- Trading Strategies
- Real Trade Examples
- VWAP on Different Timeframes
- Common Mistakes
- Trading Checklist
What is VWAP #
VWAP stands for Volume Weighted Average Price.
It is the average price of an asset for the day, weighted by the volume traded at each price level.
Unlike a simple moving average which only considers price, VWAP accounts for both price and volume together — giving you a true picture of where real money traded.
VWAP resets at the start of every trading session. It builds from the first candle and updates every minute throughout the day.
The Formula (Simplified) #
VWAP = Cumulative (Price × Volume) ÷ Cumulative VolumeEach candle contributes:
- Typical Price = (High + Low + Close) ÷ 3
- That typical price is multiplied by the candle’s volume
- All values are summed and divided by total volume
You do not need to calculate this manually. Every charting platform (TradingView, Binance, Bybit) plots VWAP automatically.
Why VWAP Matters to Institutions #
Institutional traders (mutual funds, FIIs, DII, large hedge funds) use VWAP as a benchmark for order execution.
When a large fund needs to buy 10 lakh shares, they cannot buy all at once — it would spike the price. So they break it into smaller orders and try to execute close to VWAP to get a fair average price.
This means:
- Price tends to return to VWAP repeatedly during the session
- Institutions actively defend VWAP as a support/resistance level
- Moves away from VWAP are often mean-reverting
When you trade with VWAP, you are trading alongside institutional flow — not against it.
How to Read VWAP on a Chart #
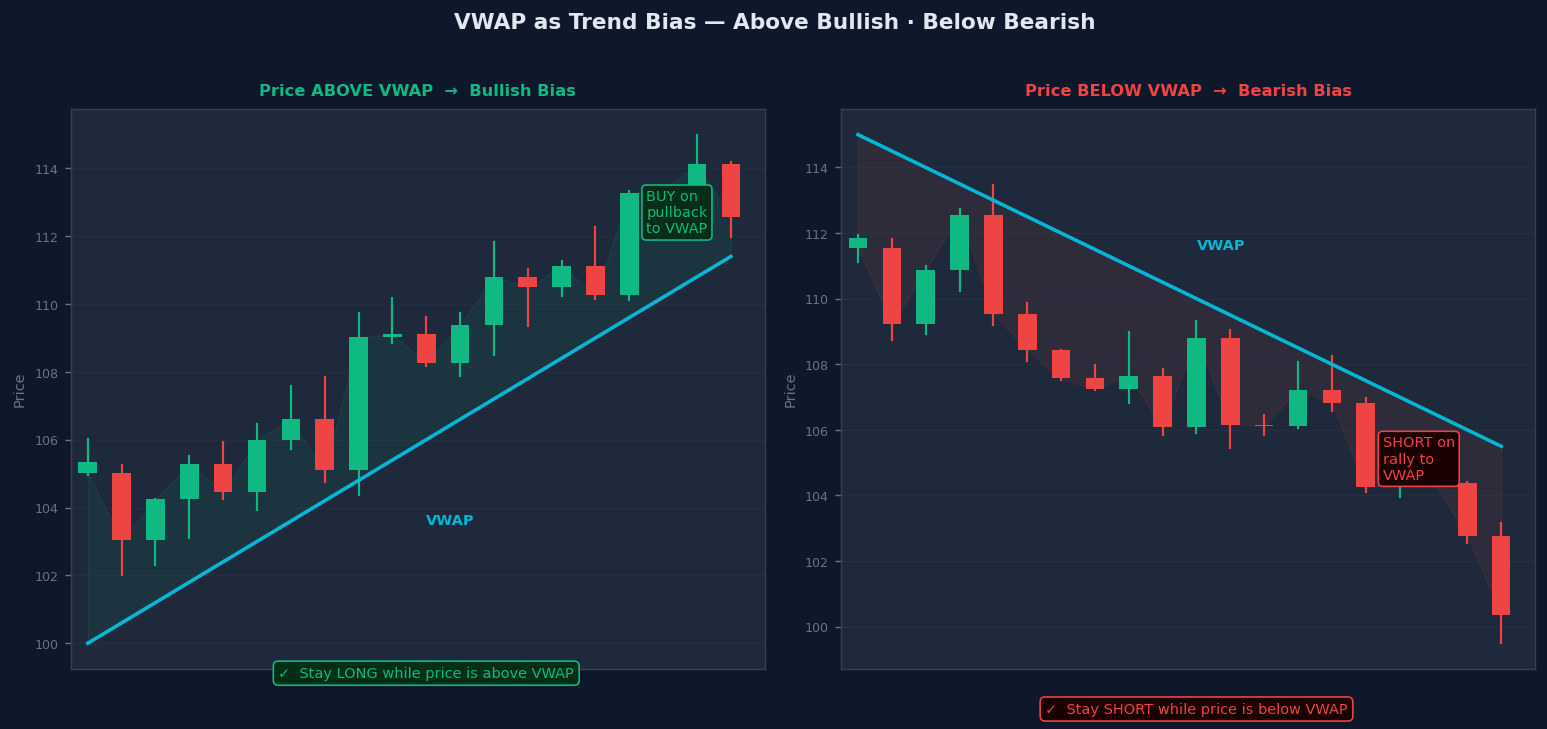
Above VWAP #
Price trading above VWAP = Bullish Bias
Buyers are in control. Institutions are paying above average price — bullish demand.
Look for long setups when price pulls back to VWAP and holds.
Below VWAP #
Price trading below VWAP = Bearish Bias
Sellers are in control. Institutions are selling below average price — bearish supply.
Look for short setups when price rallies to VWAP and gets rejected.
At VWAP #
Price oscillating around VWAP = Indecision / Consolidation
No clear directional bias. Wait for a decisive break above or below before taking a trade.
Avoid trading choppy price action at VWAP mid-session.
VWAP as Dynamic Support and Resistance #
VWAP acts as a dynamic intraday support and resistance line that shifts throughout the day.
First Touch Rule #
The first time price returns to VWAP after a strong opening move tends to produce the strongest reaction.
Example — Bitcoin:
London session opens and Bitcoin immediately rallies $800
VWAP is at $69,500 (opening gap up)
Price pulls back to $69,500 (VWAP) 2 hours later
Volume dries up at VWAP → price bounces strongly
Entry: $69,520 | Stop: $69,300 (below VWAP) | Target: $70,200
Flip Rule #
When price breaks through VWAP with strong volume, the old support becomes resistance (and vice versa).
Bitcoin opens bullish, trades above VWAP at $67,000 all morning
At 2 PM, price breaks below VWAP with a large red candle
VWAP ($67,000) now acts as resistance
Short entry on retest of $67,000 from below
VWAP Bands (Standard Deviation) #
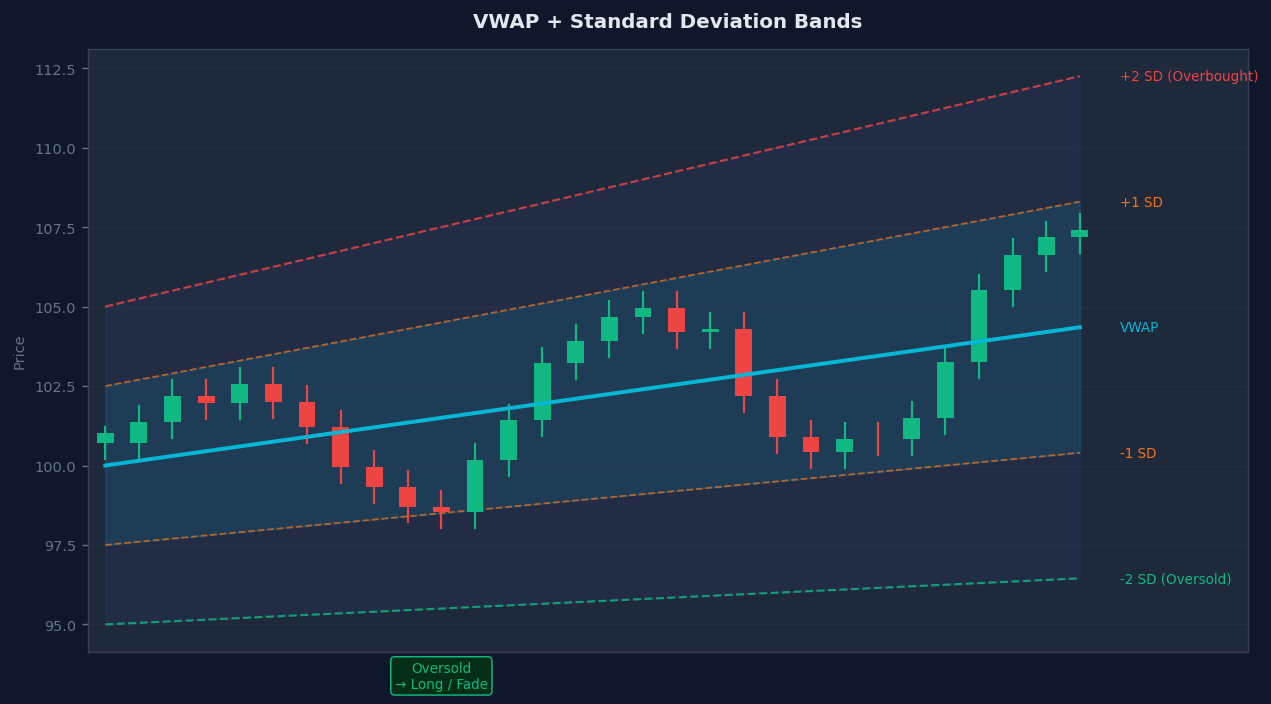
Most platforms let you add VWAP Standard Deviation Bands (also called VWAP Envelopes).
The most commonly used levels:
- +1 SD / -1 SD — Normal range (68% of price action)
- +2 SD / -2 SD — Extended range (95% of price action)
- +3 SD / -3 SD — Extreme extension
How to Use the Bands #
| Level | Meaning | Trade Idea |
|---|---|---|
| Price at +2 SD | Overbought extreme | Look for short/mean reversion |
| Price at -2 SD | Oversold extreme | Look for long/mean reversion |
| Price between ±1 SD | Normal session range | Trend-following trades |
| Price above +3 SD | Strong breakout day | Hold longs, don’t fade |
Key Rule #
On a trending day, price can stay at +2 SD for hours. Do not blindly fade extremes. Always check volume and context first.
Trading Strategies #
Strategy 1 — VWAP Pullback (Trend Following) #
Setup #
The best trend-following setup. Price breaks above VWAP, establishes trend, pulls back to VWAP, and resumes.
Conditions:
- Price opens and stays above VWAP for at least 30 minutes
- Clear uptrend structure (higher highs, higher lows)
- Strong volume on the initial breakout
Entry Rules:
- Wait for price to pull back to VWAP
- Look for a bullish candlestick reversal at VWAP (hammer, engulfing)
- Entry on the next candle open after confirmation
- Stop loss: below VWAP (typically 0.3–0.5% below)
- Target: previous session high or +1 SD band
Real Example — Bitcoin:
London open — Bitcoin immediately jumps above VWAP
First 45 min — Strong uptrend, price at +1 SD
2 hours in — Price pulls back to VWAP ($70,000)
Bullish hammer forms AT VWAP with low volume
Entry at $70,020
Stop: $69,800 (below VWAP) | Target: $70,600
Result: Price hits target within 45 minutes ✓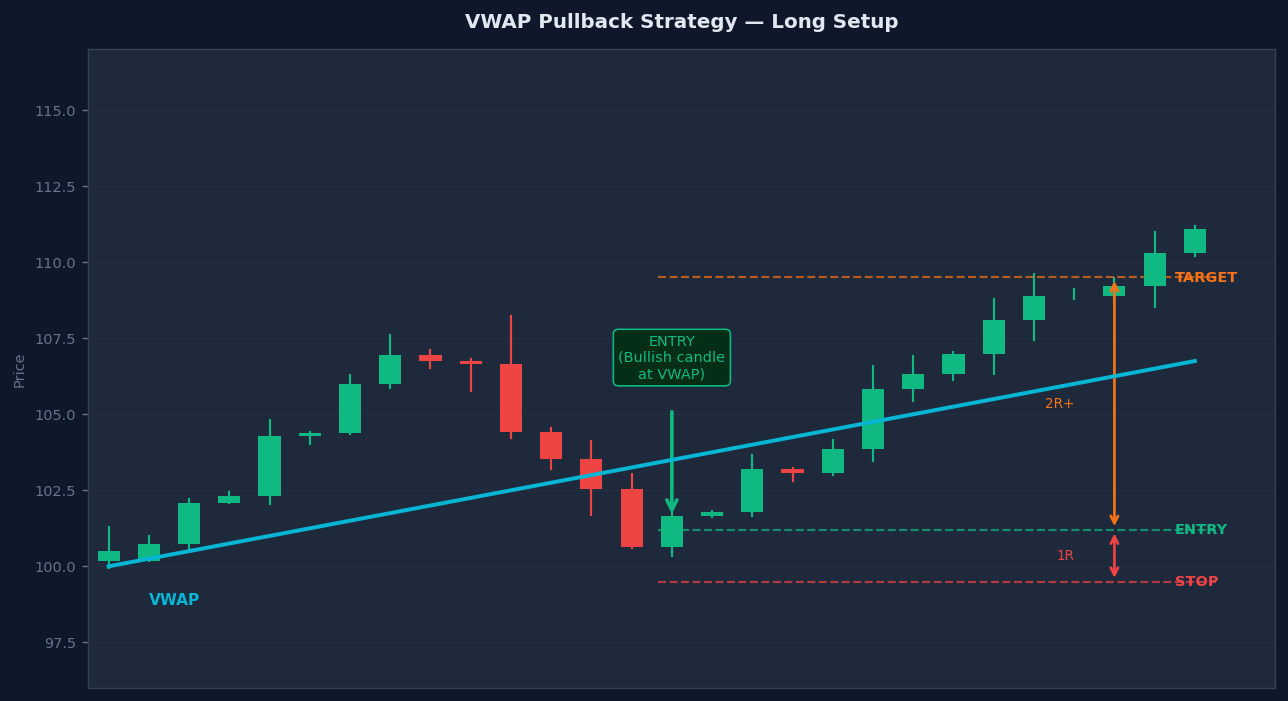
Strategy 2 — VWAP Rejection (Mean Reversion) #
Setup #
Price is in a downtrend below VWAP. It rallies back to VWAP but gets rejected. Short from resistance.
Conditions:
- Price has been below VWAP for most of the session
- Each rally to VWAP has been sold
- Volume increases on the rejection candle
Entry Rules:
- Wait for price to rally to VWAP from below
- Look for a bearish rejection candle at VWAP (shooting star, bearish engulfing)
- Entry on the break of the rejection candle’s low
- Stop loss: above VWAP (typically 0.3% above)
- Target: session low or -1 SD band
Real Example — Crypto (Bitcoin 5-min chart):
Bitcoin opens bearish — below VWAP from the first candle
VWAP at $65,500 acts as resistance all session
At 3 PM, price rallies to $65,490 (just below VWAP)
Shooting star candle forms with rising volume at VWAP
Short entry at $65,420 (on break of shooting star low)
Stop: $65,550 (above VWAP) | Target: $64,800
Result: Bitcoin drops to $64,750 within 2 hours ✓
Strategy 3 — VWAP Breakout #
Setup #
Price has been stuck near VWAP for 1–2 hours (consolidation). A sudden high-volume break above/below VWAP signals a directional move.
Conditions:
- Price oscillating around VWAP for extended time (sideways market)
- Volume drops during consolidation (energy building)
- Sudden breakout candle with 2–3x average volume
Entry Rules:
- Enter on the breakout candle close (or the next candle open)
- Stop loss: back inside the VWAP consolidation range
- Target: +2 SD band or nearest key level
Example — Bitcoin:
For 2 hours, Bitcoin chops between $69,900 and $70,100 around VWAP
Volume is low — institutions are waiting
A 5-min candle closes at $70,150 on 3x volume
This is a VWAP breakout
Entry: $70,170 | Stop: $69,980 | Target: $70,500 (+2 SD)
Result: Bitcoin reaches $70,480 within 90 minutes ✓
VWAP on Different Timeframes #
| VWAP Type | Resets | Best For | Platform Setting |
|---|---|---|---|
| Daily VWAP | Every session | Intraday trading | Default setting |
| Weekly VWAP | Every Monday open | Swing trades 1–5 days | Set anchor to week |
| Monthly VWAP | 1st of month | Position trades | Set anchor to month |
| Anchored VWAP | Any chosen candle | From key highs/lows/events | Manual anchor |
Anchored VWAP #
Anchored VWAP is the most powerful version. You anchor it to a significant price event:
- A major swing high or low
- A breakout candle
- Post-earnings gap
- An institutional accumulation zone
Price respects anchored VWAP levels across sessions, making it ideal for multi-day trade management.
Common VWAP Mistakes #
1. Using VWAP on weekly or daily charts VWAP resets each session. It is meaningless on higher timeframes. Use it only on intraday charts (1M, 3M, 5M, 15M, 30M).
2. Fading every VWAP touch On strong trending days, VWAP pullbacks may be brief or price may not return to VWAP at all. Always check the overall market structure first.
3. Ignoring volume on the setup VWAP setups without volume confirmation have much lower success rates. Volume validates the institutional participation.
4. Entering too early at VWAP Wait for a clear candlestick confirmation at VWAP — not just price touching the line. Confirmation avoids false entries.
5. Not adjusting stops after re-touch If price returns to VWAP a second or third time, the level weakens. Widen your stop or skip the trade.
VWAP Trading Checklist #
Before Entry #
- Is price clearly above OR below VWAP (not choppy around it)?
- Is the overall market trend aligned with the trade direction?
- Has price returned to VWAP after an initial directional move?
- Is volume confirming the setup (not decreasing at entry)?
Entry Confirmation #
- Is there a valid candlestick reversal signal at VWAP?
- Is the stop loss placed logically (beyond VWAP, not too tight)?
- Does the trade offer minimum 1:2 risk-reward?
- Is there a clear price target (S/R level, VWAP band, session extreme)?
Trade Management #
- Move stop to breakeven once price moves 1R in your favour
- Consider partial exit at the first key level
- Exit fully if price breaks back through VWAP against your position
Final Thoughts #
VWAP is not just another indicator — it is the price level where the most institutional money has traded during the session.
When you understand that, you stop treating VWAP as a line on a chart and start treating it as a battlefield between buyers and sellers.
Master one VWAP strategy at a time:
- Start with the VWAP Pullback in a clear trending market
- Add the VWAP Rejection for mean-reversion setups
- Graduate to Anchored VWAP for multi-day swing trades
Combine VWAP with volume, candlestick patterns, and market structure — and you will have a genuinely institutional-grade intraday framework.
Disclaimer #
This content is for educational purposes only. I am not a financial advisor. Trading involves substantial risk. Past setups do not guarantee future results. Always use proper risk management and do your own research.