Table of Contents #
- What is Volume Profile
- Volume Profile vs VWAP
- Key Components
- Point of Control (POC)
- Value Area High and Low
- High Volume Nodes (HVN)
- Low Volume Nodes (LVN)
- Types of Volume Profile
- Trading Strategies
- Real Trade Examples
- Multi-Timeframe Volume Profile
- Common Mistakes
- Trading Checklist
What is Volume Profile #
Volume Profile is a charting tool that displays trading activity at specific price levels over a chosen period — shown as horizontal bars on the right side of your chart.
The longer the bar, the more volume traded at that price.
Unlike traditional volume bars (which show volume per candle), Volume Profile shows you where price spent the most time and where the most transactions occurred.
This answers the most important question in trading:
“At which exact prices were buyers and sellers most active?”
Professional traders, institutional desks, and market makers use Volume Profile as their primary framework for identifying areas of value, potential reversals, and breakout targets.
Volume Profile vs VWAP #
| Feature | Volume Profile | VWAP |
|---|---|---|
| Shows | Volume at each price level | Average price weighted by volume |
| Resets | Chosen by trader (session/range) | Every session |
| Chart type | Horizontal histogram | Single line |
| Best for | Identifying value areas, S/R | Intraday trend bias |
| Used by | Institutional desks, CME traders | Day traders, algo systems |
Use both together for maximum confluence.
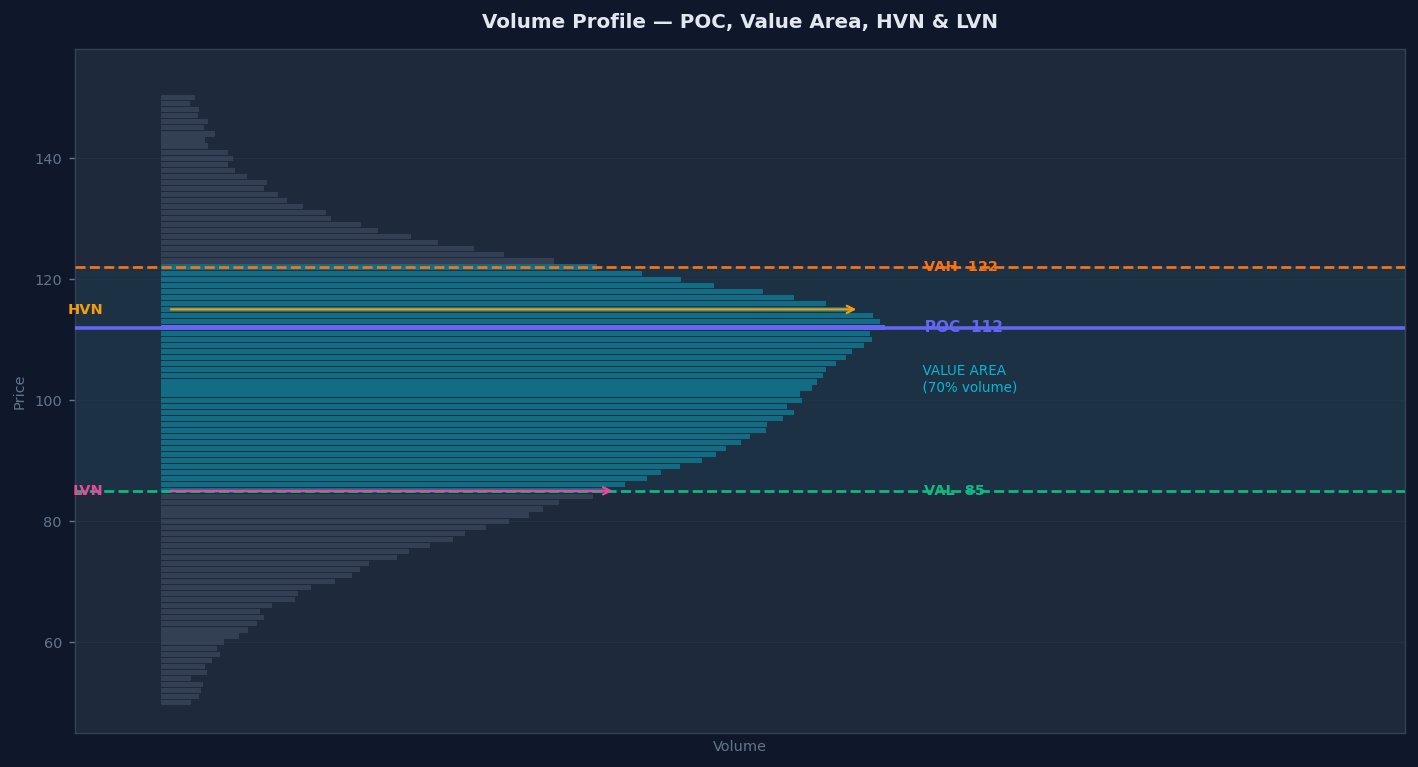
Key Components #
POC #
Point of Control
The price level with the highest volume bar. The single most-traded price in the session. Acts as a magnet — price is drawn back to POC repeatedly.
VAH #
Value Area High
The upper boundary of the Value Area. Top 70% of volume sits below this level. Strong resistance in downtrends; breakout level in uptrends.
VAL #
Value Area Low
The lower boundary of the Value Area. Bottom 70% of volume sits above this level. Strong support in uptrends; breakdown level in downtrends.
VA #
Value Area
The price range containing 70% of total session volume. Price is “fair” inside the Value Area. Moves outside the VA are statistically likely to return.
HVN #
High Volume Node
Price levels with heavy volume bars. Acts like glue — price consolidates and slows down here. Strong support and resistance areas.
LVN #
Low Volume Node
Price levels with very thin volume bars (gaps in the profile). Price moves through LVNs quickly with little resistance. Breakout targets and momentum zones.
Point of Control (POC) — The Market’s Fairest Price #
The POC is the price level where the most contracts traded during the period. It represents the market’s agreed fair value.
Why POC is Powerful #
- Price gravitates toward POC throughout the session
- POC acts as a strong magnet during low-volatility periods
- Breaks away from POC on high volume signal real directional intent
- Previous session POC often acts as next-day support/resistance
POC Trading Rules #
Rule 1: If price is above POC → Bullish bias. Look for longs on pullbacks to POC.

Rule 2: If price is below POC → Bearish bias. Look for shorts on rallies to POC.

Rule 3: When price breaks the POC with strong volume → expect follow-through
        in the direction of the break.

Rule 4: Gaps between current price and POC = eventual fill (price returns to POC)
        in 70–80% of cases.
Real Example — Bitcoin:
Previous session POC: $69,800
Next day opens at $70,200 ($400 above POC)
Within 3 hours price pulls back toward $69,800 (the old POC)
Volume clusters at $69,800 confirm this as support
Entry long: $69,820 | Stop: $69,550 | Target: $70,500
Value Area — Trading the Boundaries #
The Value Area is the zone where 70% of the previous session’s volume traded.
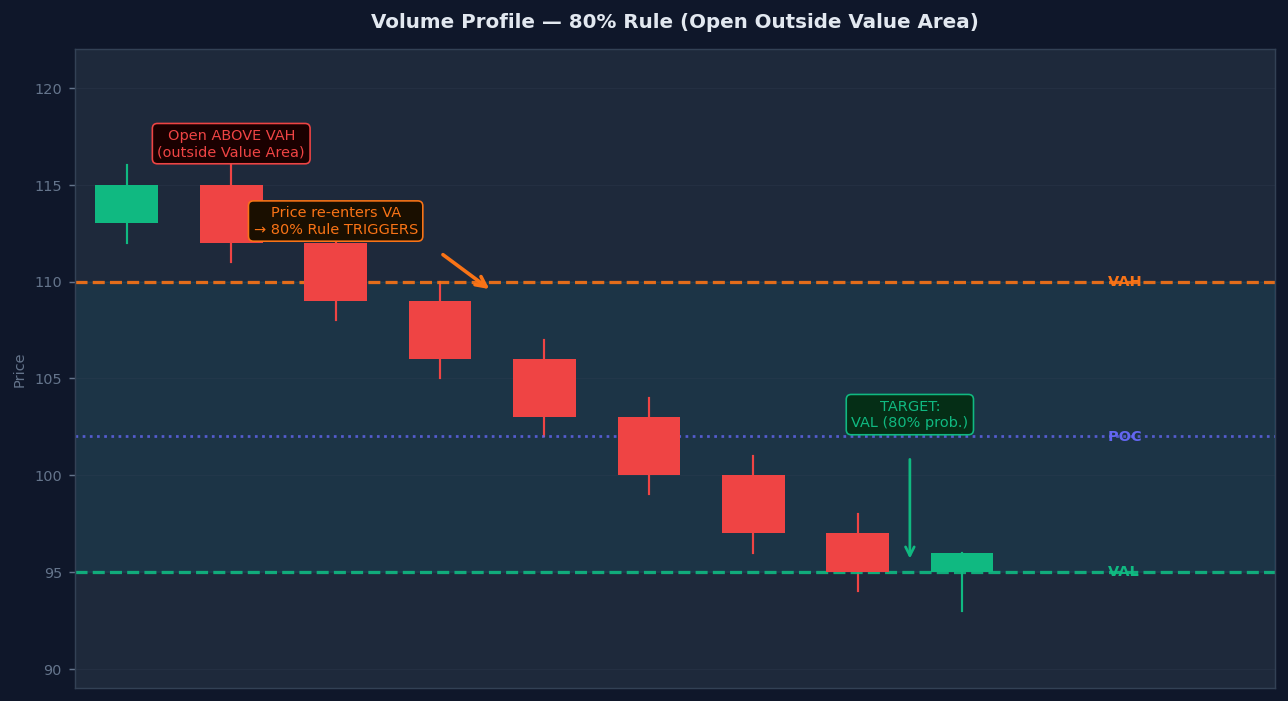
The 80% Rule #
A widely used Volume Profile rule from Market Profile theory:
If price opens outside the Value Area and then moves back inside it, it will often travel all the way to the opposite Value Area boundary — this tendency is known as the 80% Rule.
This is a statistical observation, not a guarantee. It works most reliably on liquid instruments (Bitcoin, Ethereum, major crypto pairs) during active sessions. Treat it as a high-probability bias, not a certainty.
Example:
Previous session: VAH = $70,500 | POC = $70,100 | VAL = $69,700

Today's open: $70,600 (above VAH — outside Value Area)

Price starts drifting lower and crosses back below VAH ($70,500)

Trigger: Price re-enters the Value Area

80% Rule says: Price will likely travel to VAL ($69,700)

Short entry: $70,480 (just inside VA) | Target: $69,700 | Stop: $70,650
Value Area as Support and Resistance #
- VAH = First resistance level when price is below it; becomes support when price breaks above
- VAL = First support level when price is above it; becomes resistance when price breaks below
- Price tends to auction between VAH and VAL during consolidating sessions
High Volume Nodes — Acceptance Zones #
HVNs are price levels where large volume accumulated over time. The market spent significant time here — both buyers and sellers agreed this was fair value.
Characteristics of HVN #
- Price consolidates and moves slowly through HVNs
- HVNs act as strong support AND resistance (price respects them from both directions)
- HVNs from previous weeks/months remain relevant as long-term reference points
How to Trade HVNs #
As Support: Price drops into a major HVN and slows down → look for long setups As Resistance: Price rallies into a major HVN from below → look for short setups or partial exit
Example — Bitcoin Weekly Volume Profile:
On the weekly chart, a major HVN sits at $60,000–$61,500 from 3 months of accumulation
Price drops from $68,000 and enters this HVN at $61,500
Volume slows significantly — buyers stepping in at familiar value levels
Long entry: $61,200 | Stop: $59,500 | Target: $65,000 (next HVN above)
Low Volume Nodes — Fast Lanes #
LVNs are thin areas in the profile where very little volume traded. Price passed through quickly in the past — it will likely pass through quickly again.
Why LVNs Matter #
- Price has no support/resistance within an LVN — it acts like a vacuum
- When price enters an LVN, expect a fast, impulsive move to the next HVN or VAH/VAL
- LVNs are excellent breakout targets — price can cover them in one or two candles
LVN Breakout Strategy #
Setup: Price is consolidating at/near an HVN
Signal: A strong breakout candle breaks above the HVN into an LVN above it
Entry: On the breakout candle close or next candle open
Stop: Below the HVN (back in the high-volume zone)
Target: The NEXT HVN above the LVN

Example — Bitcoin Intraday:
HVN at $69,800 (thick volume, price consolidating here 2 hours)
LVN: $69,800 to $70,500 (almost no volume historically)
Next HVN: $70,500 (strong acceptance zone above)

Price breaks above $69,800 with strong volume
Entry: $69,850 | Stop: $69,600 | Target: $70,450
Price moves through the LVN rapidly — hits $70,400 in 20 minutes ✓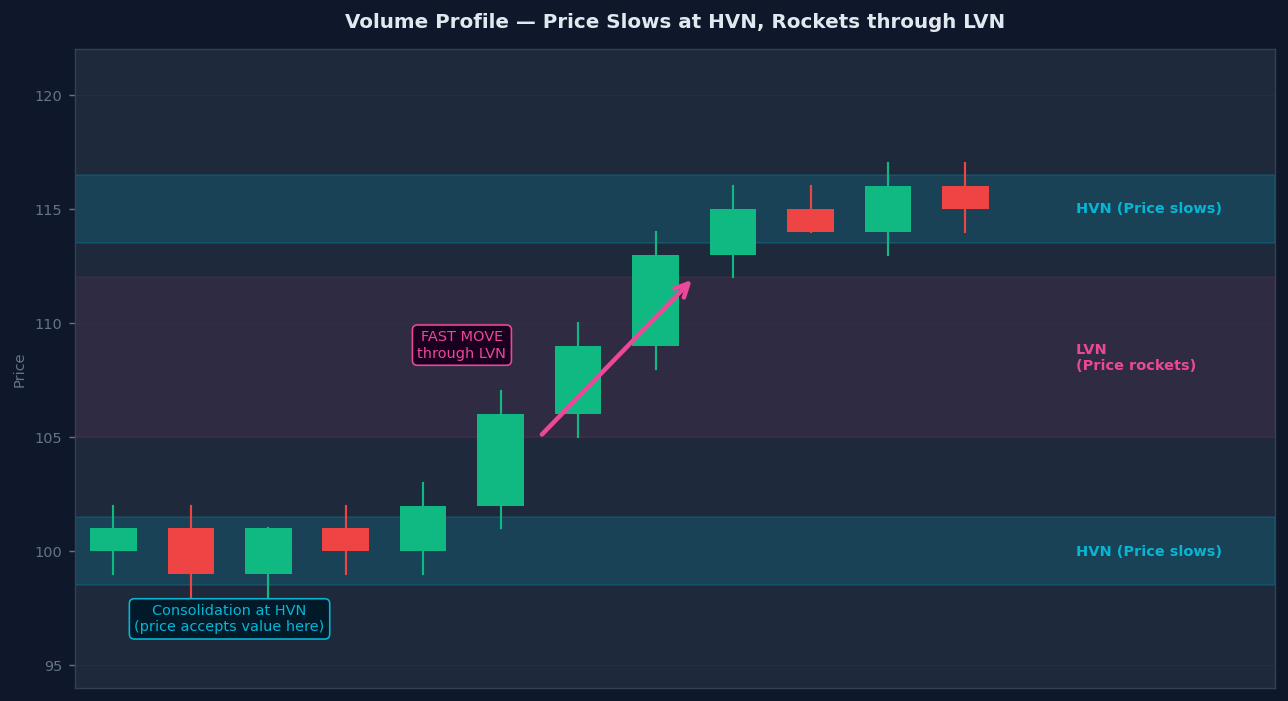
Types of Volume Profile #
| Type | Period | Best Use |
|---|---|---|
| Session Volume Profile | Single day | Intraday trading, daily reference levels |
| Visible Range VP | Whatever is on your screen | Custom range analysis, multi-day context |
| Fixed Range VP | Custom date range | Analyzing specific market phases |
| Composite VP | Multiple sessions combined | Weekly/monthly value areas for swing trades |
Which to Use #
- Day traders: Daily Session Volume Profile + Previous session reference
- Swing traders: Weekly Composite Volume Profile
- Position traders: Monthly Composite to find macro value areas
- All traders: Visible Range VP for quick context in any situation
Trading Strategies #
Strategy 1 — Open Outside Value Area #
Bullish Setup #
Price opens below the previous session’s Value Area Low (VAL).
Two scenarios:
- Price immediately rallies back above VAL → 80% Rule triggers → Target VAH
- Price continues lower and fails to re-enter VA → bearish trend day
Entry: When first 15-minute candle closes back above VAL Stop: Below the session low Target: POC first, then VAH
Previous session: VAL = 22,050 | POC = 22,200 | VAH = 22,350
Today opens at 21,980 (below VAL)
9:30 AM: 15-min candle closes at 22,070 (back above VAL)
Entry: 22,075 | Stop: 21,970 | Target 1: POC 22,200 | Target 2: VAH 22,350
Strategy 2 — POC Magnetic Retest #
Price moves away from POC on low-volume news. When momentum fades, price returns to POC.
Setup:
- Price gaps or spikes far from POC at the open
- Volume dries up in the direction of the move
- Price starts gravitating back toward POC
Entry: When price stalls and starts reversing toward POC Target: POC level Stop: Beyond the spike high/low
Bitcoin opens with a spike to $68,500 (Previous POC: $66,200)
Volume on the spike is low — no institutional follow-through
Price stalls at $68,500 and starts drifting lower
Short entry: $68,200 | Stop: $68,600 | Target: $66,200 (POC)
Result: Bitcoin returns to POC within 6 hours ✓
Strategy 3 — Value Area Fade (Mean Reversion) #
When price tests the VAH or VAL with declining volume, fade the move back toward POC.
Conditions:
- Strong trend day has ended; market is in balance
- Price reaches VAH or VAL on decreasing volume
- Candlestick reversal appears at the boundary
Entry: At VAH (short) or VAL (long) with reversal confirmation Target: POC Stop: Beyond VAH/VAL by 0.3%
Common Mistakes #
1. Using Volume Profile on forex or thin markets Volume Profile is most powerful on highly liquid markets — Bitcoin, Ethereum, major crypto pairs. Thin markets have unreliable volume data.
2. Looking at only one session Always check the composite (multi-session) Volume Profile alongside the daily profile. One session can mislead; multiple sessions show the true auction area.
3. Ignoring profile shape A “D-shaped” (normal bell curve) profile = balanced market. A “P-shaped” (volume clustered at top) = bullish (buyers accepted higher prices, shorts squeezed). A “b-shaped” (volume clustered at bottom) = bearish (sellers accepted lower prices, longs squeezed). The shape tells the story.
4. Fighting strong trends at LVNs LVNs in the middle of a strong trend will be blown through. Only fade at LVNs when the trend is weak and volume supports it.
5. Not combining with price action Volume Profile tells you WHERE to watch. Price action (candlestick patterns, S/R breaks) tells you WHEN to enter. Use both.
Volume Profile Trading Checklist #
Before the Session #
- Identify previous session POC, VAH, VAL
- Mark composite POC from the last 5 sessions
- Identify major HVNs and LVNs on the chart
- Note today’s open relative to yesterday’s Value Area
During the Session #
- Is price accepting inside the Value Area or rejecting at its boundaries?
- Is volume increasing or decreasing as price approaches key levels?
- Are POC levels acting as expected support/resistance?
Entry Rules #
- Candlestick confirmation at the Volume Profile level
- Volume confirms the reaction (should increase on reversals, decrease on fades)
- Clear stop placement (beyond the VP level)
- Minimum 1:2 risk-reward to the next VP target
Final Thoughts #
Volume Profile is not an indicator — it is a market-generated map of where participants genuinely agreed on value.
Most traders use price (what happened) while ignoring volume (how much conviction was behind it). Volume Profile bridges this gap, giving you the full picture of market structure.
Start by mastering three things:
- Where is the POC relative to current price?
- Is price inside or outside the Value Area?
- Are there nearby LVNs that could accelerate a move?
Once these become natural on your chart, you will see setups that most traders simply cannot see.
Disclaimer #
This content is for educational purposes only. I am not a financial advisor. Trading involves substantial risk. Past setups do not guarantee future results. Always use proper risk management and do your own research.