Trading Basics for Beginners #
Learn trading from the beginning with simple explanations and real examples. Understand how markets work and how to think like a professional trader.
What is Trading #
Trading means buying and selling assets like crypto and stocks to make a profit from price movements.
Prices move up and down every second. Traders try to enter at the right time and exit with profit.
Trading is not gambling. It is a skill that needs learning, patience, and discipline.
Anyone can learn it. But not everyone is willing to put in the time.
Spot vs Futures #
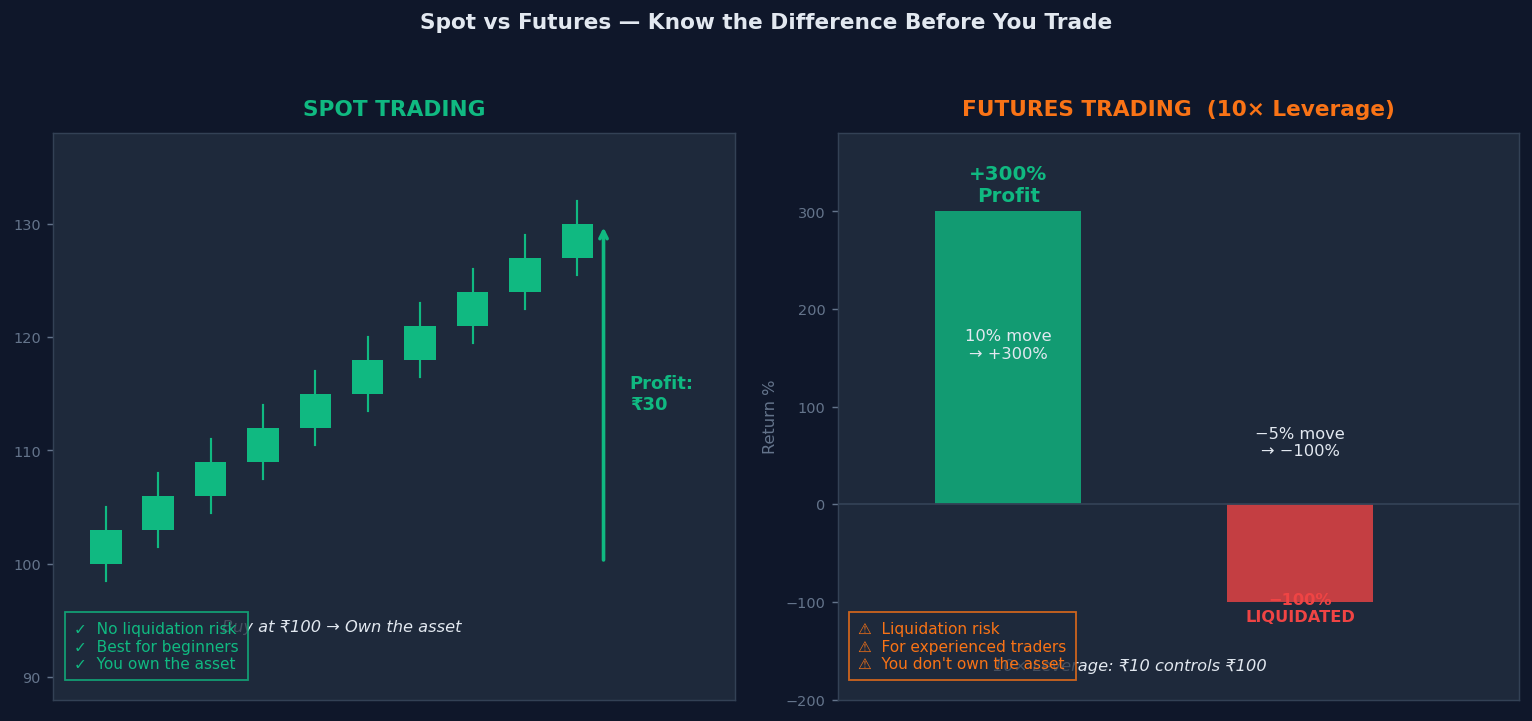
Spot Trading #
You buy the actual asset and hold it.
Profit comes when the price increases.
If price falls, you wait or exit with a small loss.
Safer and best for beginners.
Example:
You buy 1 Bitcoin at $30,000.
Price rises to $35,000.
You sell. Profit = $5,000.
Futures Trading #
You trade price movement using a contract.
You do not own the actual asset.
You can profit in both up and down markets.
Leverage is available, but risk is high.
Example:
You open a long trade on Bitcoin at $30,000 with 10x leverage.
Price rises to $31,000 (3.3% move).
With 10x, your profit = 33%.
But if price falls 10%, your full capital is gone.
Futures trading is for experienced traders, not beginners.
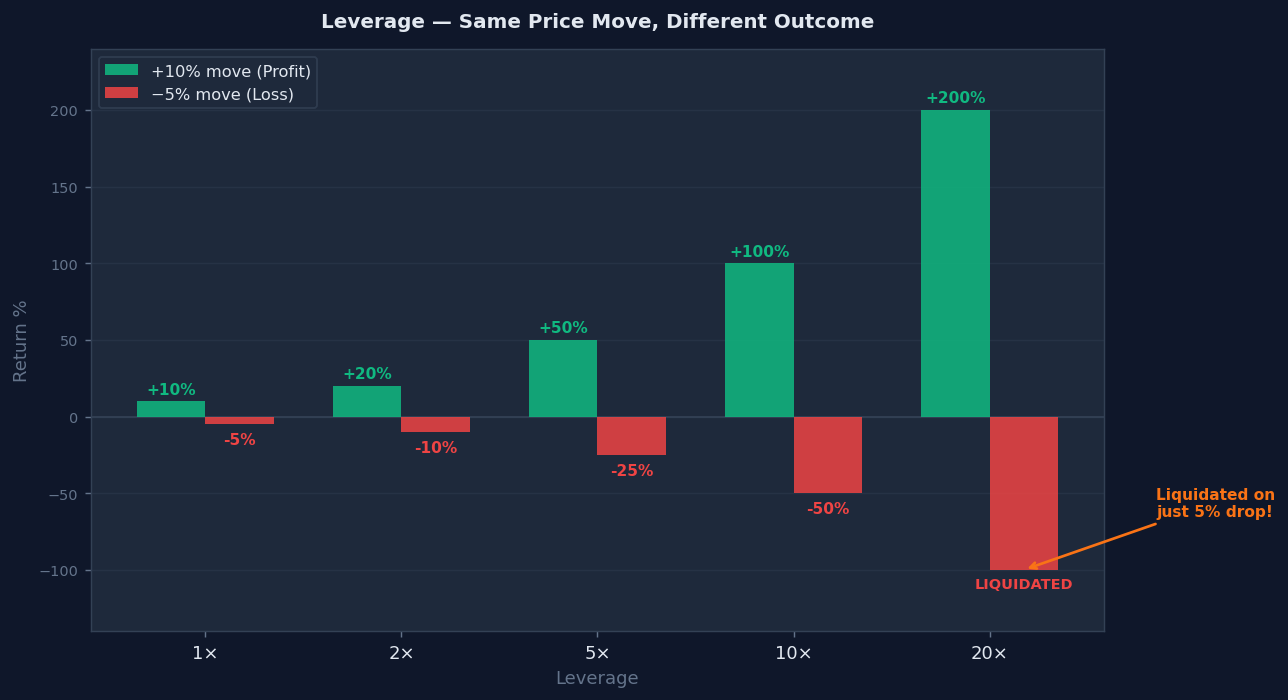
What is Leverage #
Leverage allows you to trade a bigger position with smaller capital.
Example:
$100 capital with 10x leverage = $1000 trade size.

If price moves 5% in your favour → profit = $50 (50% of your $100).
If price moves 10% against you → loss = $100 (your full capital is gone).
Higher leverage = higher risk.
Beginners should avoid high leverage until they are consistently profitable.
Recommended leverage for beginners: 5x maximum.
Market Structure #
The market is always in one of three states:
- Uptrend → price making higher highs and higher lows
- Downtrend → price making lower highs and lower lows
- Sideways → price moving between a fixed range
Identifying the correct market structure helps you decide when to trade and when to wait.
Do not try to buy in a downtrend.
Do not try to sell in an uptrend.
Trade with the structure, not against it.
Support and Resistance #
Support = a price level where buyers are strong and price stops falling.
Resistance = a price level where sellers are strong and price stops rising.
Example:
Bitcoin touches $25,000 three times and bounces up each time.
$25,000 is strong support.

Bitcoin tries to cross $30,000 twice and fails.
$30,000 is resistance.

Trade idea:
Buy near $25,000 support.
Stop loss below $24,800.
Target $30,000 resistance.
The more times a level is tested, the stronger it becomes.
Old resistance often becomes new support after a breakout.
Trend Basics #
Uptrend = Higher Highs and Higher Lows
Downtrend = Lower Highs and Lower Lows
Example of Uptrend:
Price: 100 → 120 → 110 → 135 → 122 → 150
Each high is higher. Each low is higher.
Trend is strong. Buy on pullbacks to higher lows.
Example of Downtrend:
Price: 100 → 80 → 90 → 70 → 78 → 55
Each high is lower. Each low is lower.
Trend is down. Avoid buying. Wait for reversal.
Trade with the trend for better success.
When a higher low breaks in an uptrend, trend may be ending. Be careful.
Breakout vs Fakeout #
Breakout #
Price breaks above resistance or below support with strength and continues in that direction.
Example:
Bitcoin consolidates between $28,000 and $30,000 for 2 weeks.
Day 15 → closes at $31,500 with high volume.
This is a confirmed breakout.

Entry = $31,600
Stop loss = $29,800
Target = $34,000
Wait for candle to close above the level, not just touch it.
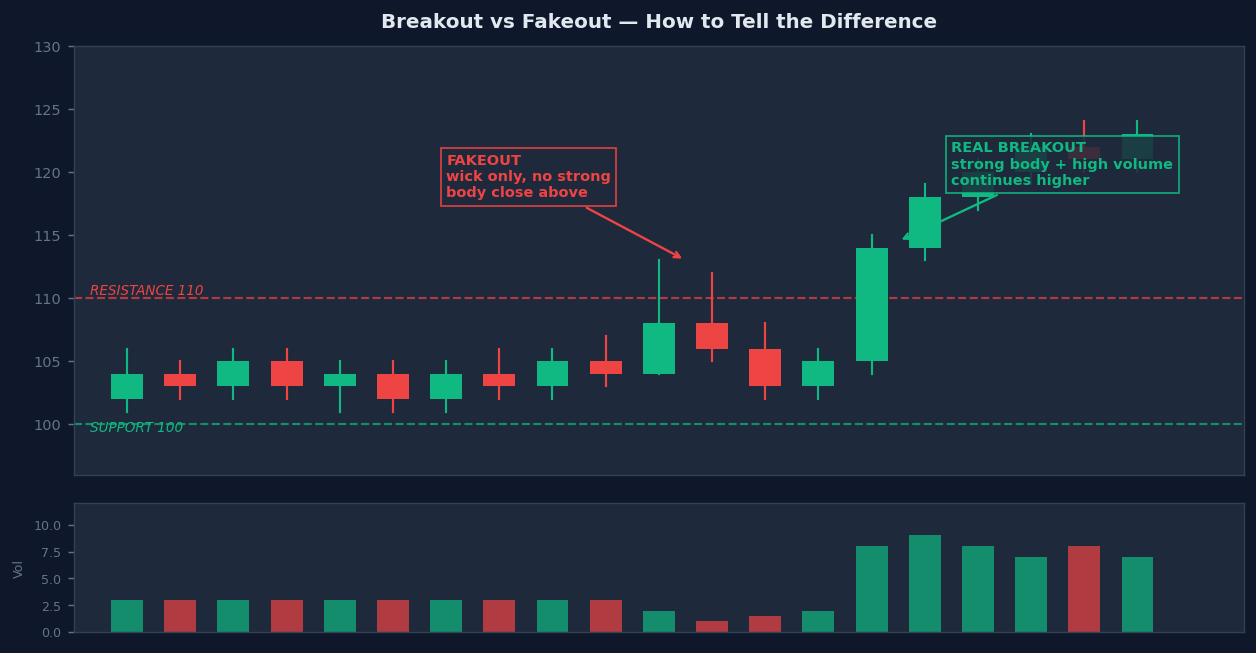
Fakeout #
Price breaks a level but quickly reverses back. Traps traders who entered early.
Example:
Resistance at $30,000.
Price spikes to $30,200.
You enter long.
Price falls back to $28,500.
You are trapped.
How to avoid fakeout:
Wait for candle close above the level.
Check that volume is strong on the breakout candle.
Weak candle with low volume = likely fakeout.
Liquidity Basics #
Market moves where money is placed.
When many traders place stop losses below a support level, big players push price down to that area to collect those stop losses.
Then price reverses strongly upward.
This is called a liquidity sweep.
Example:
Strong support at $25,000.
Many traders set stop loss at $24,900.
Price dips to $24,850, triggers all stop losses.
Price immediately bounces back above $25,000.
This is not random. Big players do this intentionally.
Do not place stop losses at obvious levels.
Smart Money Basics #
Smart money means big players — banks, institutions, hedge funds.
They move the market. Retail traders follow.
Smart money buys when price is low and everyone is selling (fear).
Smart money sells when price is high and everyone is buying (greed).
Follow price, not emotions.
When everyone is saying buy, price is often near the top.
When everyone is panicking and selling, price is often near the bottom.
Do not trade based on news or social media hype.
Trade based on what the chart is showing.
Entry and Exit Strategy #
Before entering any trade, answer these three questions:
- Why am I entering this trade?
- Where is my stop loss if I am wrong?
- Where is my target to take profit?
If you cannot answer all three, do not enter.
Example:
Why entering:
Price bounced from strong support at $25,000 with a hammer candle.
Stop loss: $24,700 (below the wick of hammer candle).
Target: $28,500 (next resistance level).
No plan = gambling.
Plan every trade before you enter. Not during or after.
Tools and Setup #
Keep your chart simple. Complicated charts create confusion.
Use only:
- Support and Resistance levels
- Trend lines
- Moving Average (optional, for trend direction)
- Volume (to confirm breakouts)
Price action is the most important tool.
Candles show you what buyers and sellers are doing right now.
Remove all indicators you do not fully understand.
Less is more in trading.
Timeframes #
Different timeframes are used for different trading styles.
- Scalping → 1-minute / 5-minute charts. Very fast trades.
- Intraday → 15-minute / 1-hour charts. Trades close same day.
- Swing → 4-hour / Daily charts. Trades held for days or weeks.
Beginners should start with 1 hour or 4 hour charts.
Larger timeframes have clearer signals and less noise.
Always check the higher timeframe first.
If daily chart shows downtrend, do not look for buy signals on 5 minute chart.
What is Risk Management #
Risk management means controlling how much money you can lose on any single trade.
Most beginners focus on profits. Professional traders focus on protecting capital first.
A trader who loses 50% of their account needs a 100% gain just to come back to the starting point.
Protecting capital is more important than making profit.
The 1% Rule #
Never risk more than 1% to 2% of your total account on one trade.
Example:
Account = $1000
1% risk = $10 per trade

Even if you lose 10 trades in a row, you only lose $100.
Account is still alive. You can recover.

If you risk 20% per trade and lose 5 trades, account is finished.
Never risk more than 1% to 2% per trade.
Small risk per trade = long trading life.
Stop Loss #
A stop loss is a fixed price where your trade closes automatically when it goes against you.
Always set stop loss before entering the trade. Not after.
Example:
Buy Bitcoin at $30,000
Set stop loss at $29,500
Maximum loss = $500 per coin
If price falls to $29,500, trade closes automatically.
You lose only $500. Not your full account.
No stop loss = no control = gambling.
Risk Reward Ratio #
Risk reward ratio means how much you risk compared to how much you aim to gain.
Example:
Risk $10 to make $20 = 1:2 ratio

With 1:2 ratio and 50% win rate:
5 wins × $20 = $100
5 losses × $10 = −$50
Net profit = $50
You can be wrong 50% of the time and still be profitable.
Good ratio keeps you profitable even with losses.
Always aim for minimum 1:2. Better if 1:3.
Position Sizing #
Position sizing means deciding how many units to buy based on your risk.
Formula:
Position Size = Risk Amount ÷ Stop Loss Distance
Example:
Account = $1000
Risk = 1% = $10
Stop loss distance = $5

Position Size = $10 ÷ $5 = 2 coins
This keeps your risk exactly $10 on every trade, no matter the price.
What is Money Management #
Money management means how you use and grow your trading capital over time.
Risk management protects you from big losses.
Money management grows your account consistently.
Both work together.
Never Revenge Trade #
Revenge trading means entering a trade immediately after a loss to recover quickly.
Example:
You lose $50 on Trade A.
You feel angry.
You open Trade B with 5x normal size to recover.
You lose again.
Now loss is $300 instead of $50.
This is how accounts get destroyed in one day.
After a loss, stop. Take a break.
Next trade must follow your normal 1% risk, not your emotion.
Partial Profit Booking #
Do not wait for full target every time. Take some profit along the way.
Example:
Buy ETH at $100. Target $140. Stop loss $90.
At $120, sell half the position. Lock in profit.
Move stop loss to $110. Now no loss is possible.
Let the rest run to $140.
You protected profit and gave room to grow.
This removes fear and greed at the same time.
Monthly Loss Limit #
Set a maximum loss limit for each month.
Example:
Account = $1000
Monthly limit = 5% = $50

If you lose $50 in a month, stop trading.
Review your mistakes. Come back next month fresh.
This prevents emotional over-trading during bad periods.
Candlestick Patterns #
Each candle tells the story of buyers and sellers in that time period.
Hammer
Long lower wick. Small body at top.
Buyers rejected low prices strongly.
Appears at support = bullish reversal signal.
Shooting Star
Long upper wick. Small body at bottom.
Sellers rejected high prices strongly.
Appears at resistance = bearish reversal signal.
Bullish Engulfing
Large green candle fully covers the previous red candle.
Strong buyers took control. Bullish signal at support.
Bearish Engulfing
Large red candle fully covers the previous green candle.
Strong sellers took control. Bearish signal at resistance.
Doji
Open and close at almost same price.
Buyers and sellers equal. No winner.
Signals indecision. Possible reversal ahead.
What is Trading Psychology #
Trading psychology means how your emotions affect your trading decisions.
You can have the best strategy.
But if emotions control your decisions, you will lose money.
Fear and greed are the two biggest enemies of a trader.
Fear of Missing Out #
FOMO means entering a trade because you are afraid of missing the move, not because of a valid setup.
Example:
Bitcoin jumps 20% in one hour.
You had no plan for it.
You buy at the top out of fear.
Price reverses. You lose.
Fix:
If you missed it, you missed it.
The market always gives another opportunity.
Never chase a candle. Wait for your setup.
Greed After Winning #
After several wins, traders feel confident and start taking bigger risks.
Example:
You win 5 trades in a row.
You feel unstoppable.
You risk 20% on Trade 6 instead of 1%.
Trade 6 loses.
All 5 wins are wiped in one trade.
Fix:
Always follow the same 1% risk rule.
Win or lose, position size never changes.
Your edge works over hundreds of trades, not just 5.
Cutting Profits Too Early #
Fear of losing profit makes traders exit early and miss the full target.
Example:
Plan: Risk $10 to make $20 (1:2 ratio).
Reality: You exit at $12 profit out of fear.

Over 10 trades with 50% win rate:
Held to target → 5 wins × $20 = $100, losses = −$50, net = +$50
Exited early → 5 wins × $12 = $60, losses = −$50, net = +$10
Same strategy. Very different result.
Trust your plan. Let trades hit target.
Holding Losing Trades #
Hoping a losing trade comes back is one of the most dangerous habits.
Example:
Stop loss at $29,500.
Price falls to $29,500.
You think it will come back.
You remove stop loss.
Price falls to $27,000.
$500 loss became $3,000 loss.
Fix:
Accept the small loss. Move on.
Small losses are normal. Big losses destroy accounts.
Stop loss is not optional.
Avoid Overtrading #
Too many trades = too many losses.
Overtrading happens from boredom, FOMO, or trying to recover losses.
Every extra trade has risk.
More trades does not mean more profit.
Fix:
Set maximum 2 to 3 trades per day.
Only enter when a clear setup appears.
If no setup, do nothing.
Waiting is a skill. Not a weakness.
Quality over quantity always.
Trading Journal #
Record every trade you take.
Write:
- Date and asset
- Entry price, stop loss, target
- Exit price and result
- Why you entered
- How you felt during the trade
- What you learned
Example:
Date: 06 May 2026
Trade: Bitcoin Long
Entry: $80,000 | Stop: $79,500 | Target: $81,000
Exit: $80,950 | Result: +$950
Emotion: Wanted to exit early at $80,600 but held
Lesson: Holding to target worked. Do not exit early.
Journal shows where you make money and where you lose.
Without it, you are guessing.
Daily Routine #
Professional traders follow a routine every day.
Before market:
- Check news and market conditions
- Mark support and resistance levels
- Identify 2 to 3 possible setups
- Set price alerts at key levels
During market:
- Only take planned setups
- Set stop loss and target before entering
- Do not watch chart every second after entering
After market:
- Record all trades in journal
- Review what went well and what went wrong
- Rate your discipline, not just profit
Weekend:
- Review full week journal
- Find patterns in mistakes
- Improve one thing for next week
Avoid These Mistakes #
- Using high leverage with no experience
- Entering without stop loss
- Revenge trading after a loss
- Risking too much on one trade
- Following signals blindly without understanding
- Overtrading when bored
- Exiting winners early and holding losers long
- Not keeping a trading journal
- Trading based on social media hype
- Changing your plan mid-trade out of emotion
Final Note #
Trading is a long-term skill.
You will not become profitable in one week.
Losses are part of the journey.
Every loss teaches something if you pay attention.
Focus on:
- Protecting your capital
- Following your plan
- Managing your emotions
- Learning from every trade
Profit comes with time.
Stay patient. Stay disciplined. Trade smart.