Table of Contents #
- Why Planning Beats Reacting
- The 5-Step Trade Plan
- Step 1 — Higher Timeframe Bias
- Step 2 — Find the Key Level
- Step 3 — Wait for the Entry Signal
- Step 4 — Define Risk (Entry, Stop, Target)
- Step 5 — Execute and Manage
- Long Trade Plan — Full Buy Entry Example
- Short Trade Plan — Full Sell Entry Example
- Confluence Scoring Before Every Trade
- Position Sizing With Your Plan
- Common Planning Mistakes
- Trade Plan Checklist
Why Planning Beats Reacting #
There are two types of traders:
The Reactor — Sees price moving fast, feels FOMO, jumps in. No defined stop. No defined target. Exits on emotion when it goes against them. Takes profit too early when it works. Net result: inconsistent.
The Planner — Identifies the setup in advance. Writes the entry, stop, and target before the market opens. When the setup triggers, executes the plan mechanically. Net result: consistent.
The difference is not intelligence. It is process.
What a Trade Plan Does For You #
- Removes emotion from execution — you made the decision before the pressure hit
- Forces you to define risk before reward — you know exactly what you are risking
- Keeps you selective — only high-quality setups that pass all criteria get traded
- Gives you something to review and improve — a planned trade teaches you more than a random one
The best traders are not smarter than others. They are more disciplined. A trade plan is how you enforce discipline on yourself.
The 5-Step Trade Plan #
Every trade plan — whether for a 5-minute scalp or a daily swing trade — has the same five components:
| Step | What to Define | Question to Answer |
|---|---|---|
| 1 | Higher Timeframe Bias | What is the trend on the higher timeframe? |
| 2 | Key Level | Where is price going to react? |
| 3 | Entry Signal | What specific pattern triggers the entry? |
| 4 | Risk Parameters | Entry price, stop loss, target(s), R:R |
| 5 | Management Rules | How will you manage the trade once live? |
You must be able to answer all five before you place the order. If you cannot, you do not have a plan — you have a guess.
Step 1 — Higher Timeframe Bias #
The higher timeframe tells you the direction. The lower timeframe tells you the entry.
Never trade against the higher timeframe trend unless you have very specific counter-trend criteria (which most beginners should not attempt).
Timeframe Combinations #
| Trading Style | Higher TF (Bias) | Entry TF (Signal) |
|---|---|---|
| Scalping | 15M | 1M or 5M |
| Intraday | 1H or 4H | 15M |
| Swing | Daily | 1H or 4H |
| Position | Weekly | Daily |
How to Establish Bias #
Bullish bias conditions:
- Higher Highs and Higher Lows on the higher timeframe
- Price is above key moving averages (VWAP, EMA)
- Recent BOS (Break of Structure) to the upside
Bearish bias conditions:
- Lower Highs and Lower Lows on the higher timeframe
- Price is below key moving averages
- Recent BOS to the downside
No trade conditions:
- Price is in the middle of a range with no clear trend
- Recent BOS was immediately reversed (CHoCH)
- Two or more consecutive doji candles on the higher timeframe (indecision)
Step 2 — Find the Key Level #
A key level is the price at which you expect the market to react. It is the reason your trade makes sense.
Without a key level, you are trading at a random price hoping it goes your direction. With a key level, you are trading at a location where institutional activity, supply/demand imbalances, or structural importance gives you a statistical edge.
Types of Key Levels (in priority order) #
- Major swing highs/lows — price has respected these multiple times before
- Demand/Supply zones — origin of the last explosive impulse move
- Previous session high/low — intraday benchmark; institutions reference these
- VWAP — the institutional intraday fair value benchmark
- Volume Profile POC — the most-traded price of the session
- Fibonacci Golden Zone (0.618–0.786) — aligns with multiple other levels
- Round numbers — $65,000 / $70,000 / $75,000 — psychological magnets
The Golden Rule #
The more levels that stack at the same price zone, the stronger that level is.
VWAP at $69,800 is a level. VWAP + Demand Zone + Previous Day Low all at $69,700–$69,900 is a high-conviction setup area.
Step 3 — Wait for the Entry Signal #
Once you have your direction and your level — wait. Do not chase. Do not enter early. Price must come to your level AND show a clear entry signal before you act.
Entry Signal Hierarchy #
Single-candle signals (require confirmation candle):
- Hammer at support → wait for next candle to confirm bullish
- Shooting star at resistance → wait for next candle to confirm bearish
- Doji at key level → wait for direction candle
Two-candle signals (enter on close or next candle open):
- Bullish engulfing at support → enter above engulfing candle high
- Bearish engulfing at resistance → enter below engulfing candle low
- Inside bar breakout → enter above/below inside bar on breakout
Three-candle signals (strongest):
- Morning Star at support → enter above candle 3 high
- Evening Star at resistance → enter below candle 3 low
The One Unbreakable Rule #
Never enter on a candle that has not closed.
A candle that looks like a hammer at 90% completion can close as a shooting star. Only a fully closed candle is a valid signal.
Step 4 — Define Risk (Entry, Stop, Target) #
This is the most mechanical step — and the one most traders skip. Everything must be defined in numbers before you place the order.
Entry Price #
Your entry is determined by the signal:
- Pattern breakout: entry above/below the signal candle’s extreme
- Market order: entry at current price on signal candle close
- Limit order: entry at the key level itself (for aggressive entries)
Stop Loss Placement #
The stop goes beyond the reason the trade made sense. If the trade was based on a hammer at support, the stop goes below the hammer’s full wick — because if price drops that far, the support is broken and the trade premise is invalid.
Bullish setups:   Stop below the signal candle low (+ small buffer)
Bearish setups:   Stop above the signal candle high (+ small buffer)
Buffer:           0.2–0.3% beyond the candle extreme for crypto
Never place a stop at a round number (e.g. exactly 22,000). The market hunts round-number stops. Place it slightly beyond.
Target Setting #
Target 1 — nearest key level in the trade direction (minimum 2× the stop distance)
Target 2 — next significant level beyond Target 1 (for runners / partial position)
If the nearest available target only gives you 1:1 reward, skip the trade. A trade that cannot achieve minimum 1:2 R:R is not worth taking.
Minimum R:R by Setup Quality #
| Setup Quality | Minimum R:R |
|---|---|
| A+ setup (3+ confluences) | 1:2 |
| B setup (2 confluences) | 1:2.5 |
| C setup (1 confluence) | Do not trade |
Step 5 — Execute and Manage #
Once the trade is live, management rules decide the outcome. Define these before entering.
Management Rules #
Partial profit taking: Close 50–60% of the position at Target 1. Move stop to breakeven. Let the rest run to Target 2.
Trailing stop: Once Target 1 is hit and stop moved to breakeven, trail the stop behind each new swing low (for longs) or swing high (for shorts).
Early exit criteria: Exit early (before stop or target) only if:
- The higher timeframe trend changes (BOS in opposite direction)
- A strong reversal signal appears against your position on the entry timeframe
- News or event causes the trade premise to become invalid
The one rule you must never break: Do not widen your stop loss. If price is approaching your stop, let it hit. The stop is where your trade idea was wrong — widening it just means holding a losing trade longer.
Long Trade Plan — Full Buy Entry Example #
The Full Plan (Written Before Entry) #
Market:      Bitcoin 15M
Date/Time:   During London or US session

STEP 1 — HTF BIAS:
Daily: Uptrend — Higher Highs and Higher Lows
1H:   Pullback in progress toward demand zone
Bias: BULLISH — looking for long entries only

STEP 2 — KEY LEVEL:
Demand Zone: 111–112 (origin of last impulse leg up)
Also at this zone:
  → Previous swing low (structure support)
  → VWAP sitting at 110.80
  → Fibonacci 0.618 of the last up-move = 111.20
  Confluence Score: 4/5 ✓

STEP 3 — ENTRY SIGNAL:
Waiting for: Hammer, bullish engulfing, or morning star at 111–112 zone

STEP 4 — RISK PARAMETERS:
Entry:    111.00 (above hammer/engulfing high)
Stop:     105.50 (below hammer low + buffer)
Target 1: 122.00 (next swing high) — R:R 2.0
Target 2: 135.00 (trend extension) — R:R 4.4
Risk:     5.5 points
Capital risk: 1% of account

STEP 5 — MANAGEMENT:
Close 50% at Target 1 (122)
Move stop to breakeven after Target 1 hit
Trail stop behind swing lows for remainder
Exit if 1H closes below 108 (structure break)
Short Trade Plan — Full Sell Entry Example #
The Full Plan (Written Before Entry) #
Market:      Bitcoin 15M
Date/Time:   During active session

STEP 1 — HTF BIAS:
Daily: Downtrend — Lower Highs and Lower Lows
4H:   Rally in progress toward supply zone
Bias: BEARISH — looking for short entries only

STEP 2 — KEY LEVEL:
Supply Zone: 128–132 (origin of last impulse leg down)
Also at this zone:
  → Previous breakdown level (structure resistance)
  → VWAP anchored from recent swing high = 130.20
  → Fibonacci 0.618 retracement of the last down-move = 129.80
  Confluence Score: 4/5 ✓

STEP 3 — ENTRY SIGNAL:
Waiting for: Shooting star, bearish engulfing, or evening star at 128–132 zone

STEP 4 — RISK PARAMETERS:
Entry:    129.00 (below shooting star low)
Stop:     134.50 (above shooting star wick + buffer)
Target 1: 118.00 (next swing low) — R:R 2.0
Target 2: 105.00 (trend extension) — R:R 4.4
Risk:     5.5 points
Capital risk: 1% of account

STEP 5 — MANAGEMENT:
Close 50% at Target 1 (118)
Move stop to breakeven after Target 1 hit
Trail stop behind swing highs for remainder
Exit if 4H closes above 133 (structure break against position)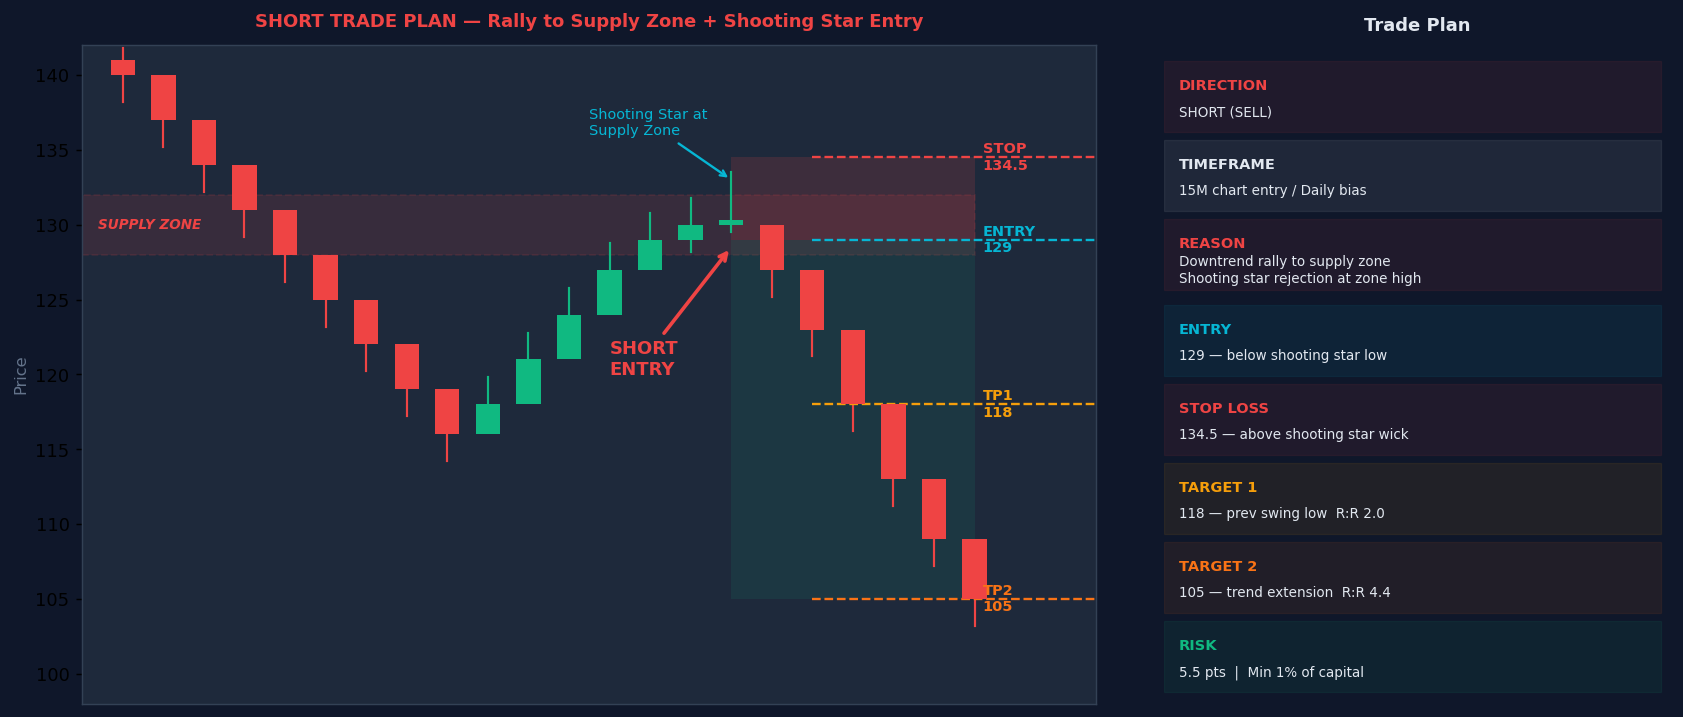
Confluence Scoring Before Every Trade #
Before executing any trade, score it on 5 criteria. Only take trades that score 4 or 5.
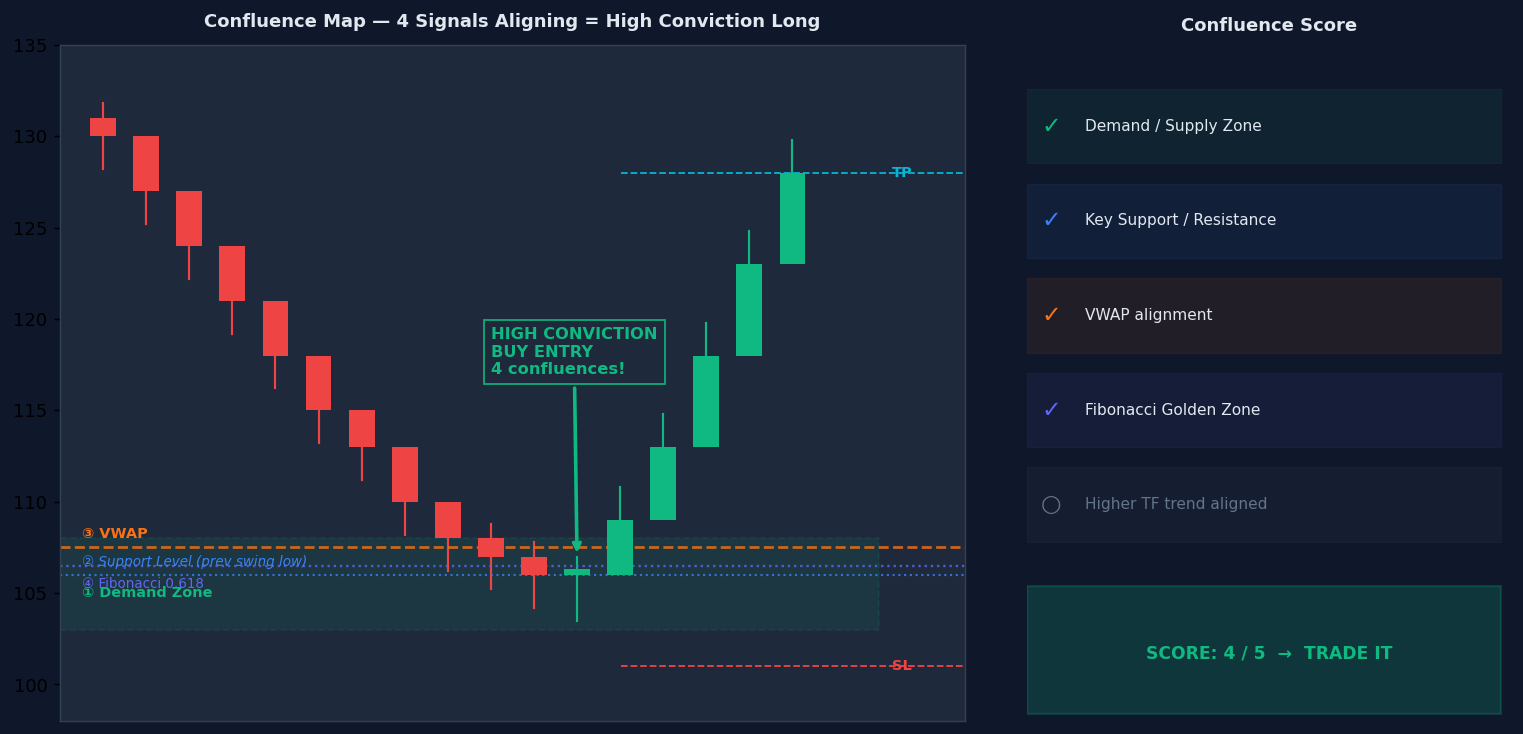
| Criteria | Check | Points |
|---|---|---|
| Higher timeframe trend aligned | Is the entry in the trend direction? | 1 |
| Key level present | Is price at S/R, demand/supply, or VWAP? | 1 |
| Clear entry signal | Is there a valid candlestick pattern? | 1 |
| Additional confluence | Does Fibonacci, VP POC, or another level align? | 1 |
| Volume confirmation | Is volume declining into the level and picking up on signal? | 1 |
Score 5/5 → A+ trade. Full position size. Score 4/5 → A trade. Full position size. Score 3/5 → B trade. Half position size or skip. Score 2/5 or below → Do not trade.
Position Sizing With Your Plan #
Your trade plan is not complete without knowing exactly how many lots/contracts/units to trade.
The Formula #
Position Size = (Account × Risk %) ÷ Stop Distance

Example:
Account:        $10,000
Risk per trade:  1% = $100
Stop distance:   $700 (1% of BTC at $70,000)

Position Size = $100 ÷ $700 = 0.143 BTC
Why This Matters #
Every trade has a different stop distance. Without this calculation, you are either:
- Risking too much on wide-stop trades (overleveraged)
- Risking too little on tight-stop trades (underutilizing your edge)
Proper position sizing means your risk is consistent at 1% regardless of where the stop is.
Maximum Risk Per Trade: 1–2% #
Never risk more than 2% of your account on any single trade. At 1% risk, you can have 20 consecutive losing trades and still have 82% of your capital intact. At 10% risk, 10 losses in a row wipes your account.
Common Planning Mistakes #
1. Planning after the trade (not before) Writing your stop and target after you are already in a position is not a plan — it is rationalisation. The plan must exist before the order is placed.
2. Moving the stop loss The most dangerous habit in trading. If price moves toward your stop, your trade idea is being tested. Let it play out. The stop is the maximum loss you pre-defined for a reason.
3. Taking profit too early Closing at 40% of your target because “it might reverse” is emotional, not analytical. If Target 1 was defined correctly, let price reach it. Early exits destroy your average R:R.
4. Trading setups that do not reach the key level If you planned to buy at 22,100 and price turns at 22,250 without reaching your level — you do not have a plan anymore. Skip the trade. Chasing is the enemy of consistency.
5. Skipping the confluence check One reason to be in a trade is not enough. One support level alone is not a plan — price can break through a single level easily. Multiple confluences at the same zone make it a plan.
6. Not writing it down Mental plans change under pressure. Written plans do not. Keep a trade log or journal — even a simple note on your phone. The act of writing forces clarity.
Trade Plan Checklist #
Before the Session (Pre-Market) #
- Identify the higher timeframe trend (daily/4H)
- Mark key levels for the day (demand/supply zones, VWAP, prev day H/L)
- Set price alerts at key levels so you are notified when price arrives
When Price Reaches a Key Level #
- Is the HTF trend aligned with a trade in this direction?
- How many confluences stack at this level? (score ≥ 4/5)
- What is the specific entry signal I am waiting for?
Before Placing the Order #
- Is the signal candle fully CLOSED?
- Entry price defined: ______
- Stop loss defined: ______ (beyond signal candle extreme)
- Target 1 defined: ______ (R:R of at least 2:1?)
- Target 2 defined: ______ (where to hold runners?)
- Position size calculated using the 1% risk formula?
After the Trade is Live #
- Stop loss order placed in the system (not just in your head)?
- At Target 1, partial close and move stop to breakeven?
- Exit criteria noted if market structure breaks against position?
Final Thoughts #
The best trade setups in the world fail when taken without a plan. And mediocre setups succeed when executed with discipline.
Your edge in trading is not finding perfect setups — it is executing your plan consistently, win or lose. Over 100 trades, a process-driven trader will outperform a pattern-chasing trader every time.
Build the habit:
- Write the trade plan before every entry
- Define entry, stop, and target in numbers
- Score the confluence (trade only 4+/5)
- Size correctly using the 1% rule
- Let the plan play out — do not interfere
The market will always give you more opportunities. Your job is to be selective, be patient, and execute your plan when the conditions are right.
Disclaimer #
This content is for educational purposes only. I am not a financial advisor. Trading involves substantial risk. Past setups do not guarantee future results. Always use proper risk management.