Table of Contents #
- What is Support and Resistance
- The Real Meaning of S/R
- Types of Support and Resistance
- How to Draw Horizontal S/R (Step by Step)
- How to Draw Trendlines
- Role Reversal — Support Becomes Resistance
- Strength of an S/R Level
- Psychological Levels
- S/R vs Zones vs Lines
- Demand & Supply Zones — Institutional Order Areas
- How to Draw a Demand Zone
- How to Draw a Supply Zone
- Fresh vs Used Zones
- Real Trade Examples
- Multi-Timeframe S/R
- Common Mistakes
- S/R Trading Checklist
What is Support and Resistance #
Support is a price level where buying interest is strong enough to prevent the price from falling further. Think of it as a floor — sellers push price down, but buyers step in and hold it up.
Resistance is a price level where selling interest is strong enough to prevent price from rising further. Think of it as a ceiling — buyers push price up, but sellers step in and hold it down.
Support and Resistance are not magic lines. They represent price levels where a significant number of buy or sell orders are concentrated — either from prior trading activity or from psychological round numbers.
A level is only valid if the market has proven it respects that price. You are identifying history, not predicting the future.
The Real Meaning of S/R #
Price moves in two phases:
- Impulse — Strong directional move, driven by institutional orders
- Correction — Price pulls back, institutions add to positions
Support and Resistance mark the boundaries of these phases — they are where institutional participants have previously placed significant orders.
When price returns to these levels:
- Existing position holders defend their entry by adding more
- Fresh participants see value and enter at the same level
- Stop losses from the opposite side get triggered, adding fuel
This is why strong S/R levels produce sharp, decisive reversals — not because the “line is magical” but because orders cluster at those prices.
Types of Support and Resistance #
Horizontal S/R #
Drawn as flat horizontal lines at swing highs and swing lows. The most important type. Based on prior price rejection — the cleanest and most reliable.
Trendline S/R #
Drawn diagonally connecting swing lows (support trendline) or swing highs (resistance trendline). Dynamic — the level changes with each candle. Common in trends.
Psychological S/R #
Round numbers: 22,000 / 45,000 / $60,000 / $100,000. Large institutional orders cluster here. Even without prior price history, these act as natural S/R.
Moving Average S/R #
50 EMA, 200 EMA, 20 SMA act as dynamic S/R in trending markets. Price pulls back to the MA and bounces. Most useful in combination with horizontal S/R.
Prior High / Low #
The previous day’s high, the previous week’s high/low, the previous month’s high/low. These are watched by professional traders worldwide and reliably generate reactions.
Volume-Based S/R #
High Volume Nodes from Volume Profile (previously covered). Price slows at HVNs — these are the highest-conviction S/R levels because they are backed by actual transaction volume.
How to Draw Horizontal S/R — Step by Step #
Step 1: Start on the Higher Timeframe #
Always begin on the Daily or 4-Hour chart before going to lower timeframes.
Higher timeframe levels are seen by more participants and produce stronger reactions.
Step 2: Identify Swing Highs and Swing Lows #
A swing high = a candle with lower highs on both sides (peak) A swing low = a candle with higher lows on both sides (valley)
Look for swings that have 3 or more candles on each side — this ensures the level is significant, not noise.
Step 3: Draw the Line at the Candle Body, Not the Wick #
This is where most beginners go wrong.
Rule: Draw your S/R line at the body close/open level, not at the wick extreme.
Why? Wicks represent price probing a level. Bodies represent where the market accepted price (where it opened and closed). The body level is where orders actually filled.
Candle at resistance:
High (wick): 22,350
Open: 22,290
Close: 22,260  ← Draw your resistance line HERE
Low: 22,240
Step 4: Use a Zone, Not a Precise Line #
Price is not precise. S/R should be drawn as a zone of 0.2–0.5% around the key level — not a razor-thin line.
If a key level is at 22,200:
Draw the zone from 22,180 to 22,220 (20-point zone)
Entries and reactions can happen anywhere inside this zone
Step 5: Mark Only the Most Significant Levels (3–5 Maximum) #
Too many lines = noise. Mark only levels where price made a clear and decisive reversal with at least 2 confirmations (tested the level at least twice).
Beginners draw 15 lines. Professionals draw 3–5.
How to Draw Trendlines #
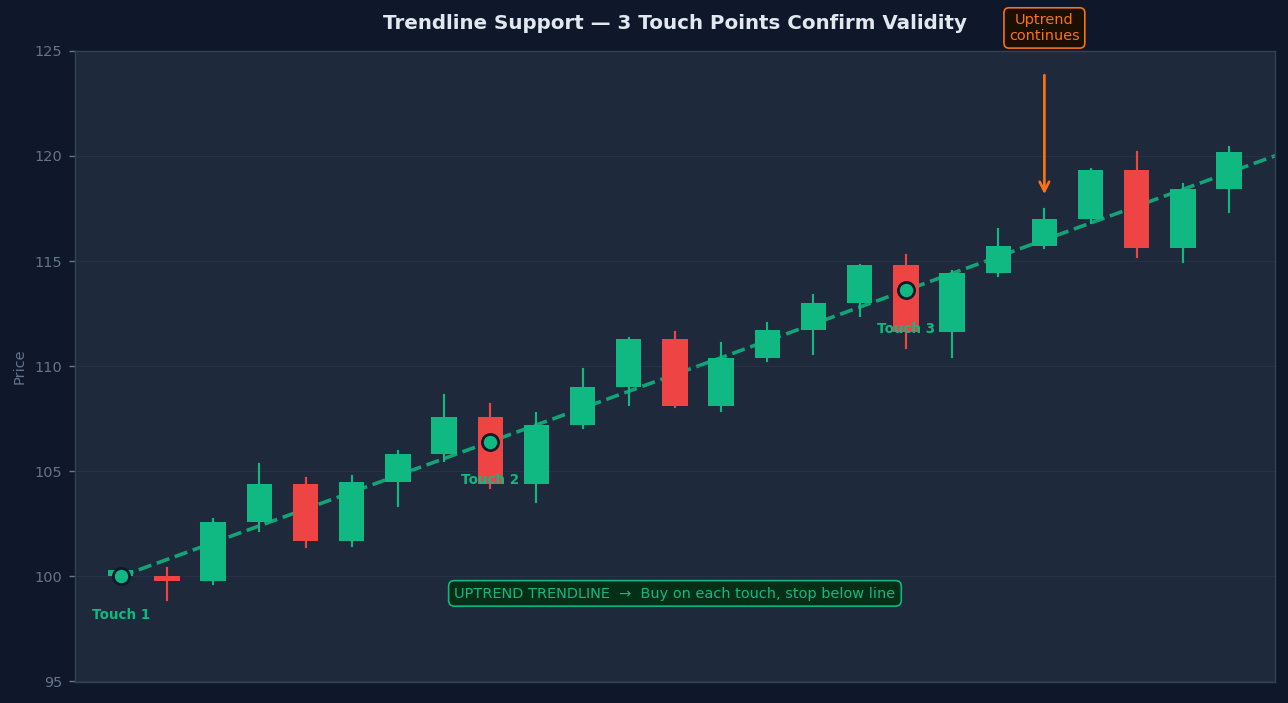
A trendline connects at least two confirmed swing points with a third confirming the validity.
Uptrend Support Line #
Connect two or more higher lows with a straight line extending to the right.
Example — Bitcoin Uptrend:
Higher Low 1: $58,000 (March 15)
Higher Low 2: $62,000 (April 2)
Higher Low 3: $65,500 (April 18) ← Confirms trendline validity

The trendline rises from $58,000 to $62,000 to $65,500
Each touch = potential long entry
Break below trendline with volume = trend change signal
Downtrend Resistance Line #
Connect two or more lower highs with a straight line extending to the right.
Example — Bitcoin Downtrend:
Lower High 1: $72,000 (Jan 20)
Lower High 2: $70,500 (Feb 5)
Lower High 3: $69,200 (Feb 19) ← Confirms validity

Short entries on each trendline touch
Break above trendline = potential trend change
Trendline Rules #
- Minimum 2 touches to draw, 3 touches to confirm validity
- Steeper trendlines (>45°) break more easily — be cautious
- The more touches, the stronger the trendline — but also the closer it is to breaking
- Always combine with horizontal S/R and volume for entry confirmation
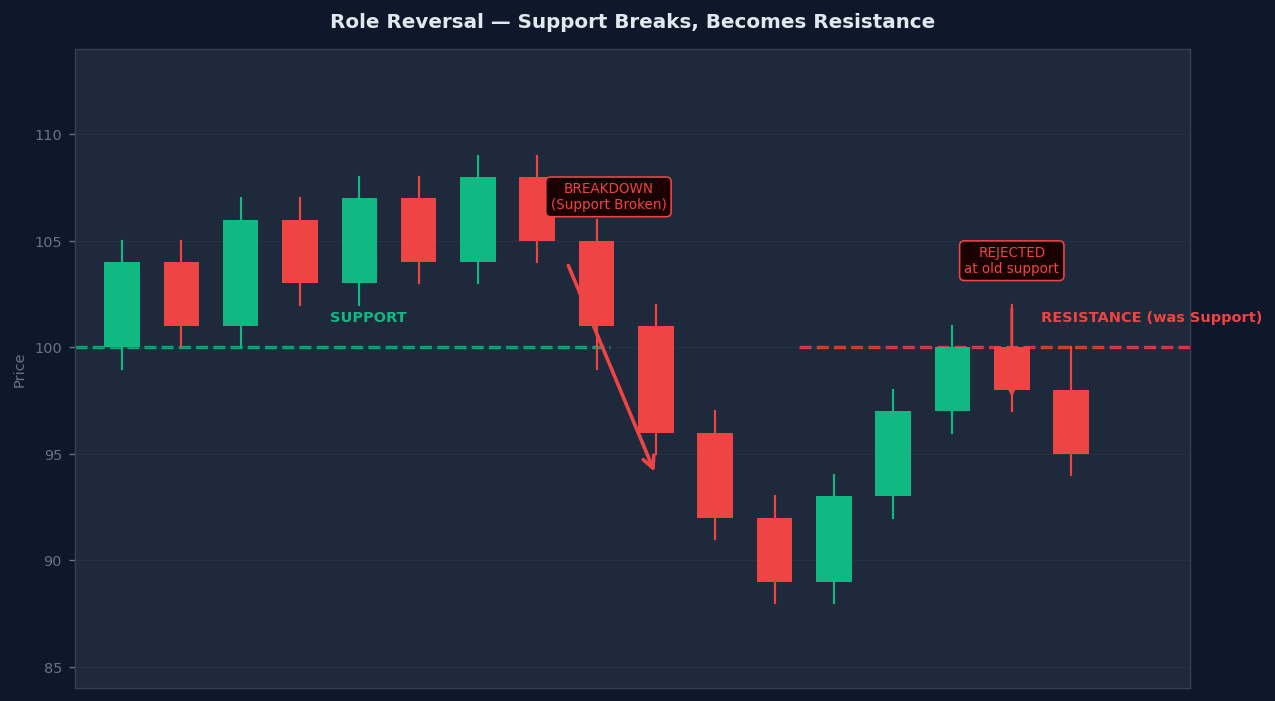
Role Reversal — Support Becomes Resistance #
The most powerful concept in S/R trading:
When a support level breaks, it becomes resistance. When a resistance level breaks, it becomes support.
Why This Happens #
When a support level breaks:
- Everyone who bought at that support is now in a losing trade
- They are waiting for price to return to their entry to “exit at breakeven”
- This creates selling pressure every time price returns to the old support level
- The old support is now a ceiling of sellers
Real Example — Bitcoin:
Bitcoin has strong support at $70,000 (tested 4 times over 6 weeks)
On day 7, price breaks below $70,000 on heavy volume
Price drops to $67,500
Three days later, price rallies back up to $70,000

→ Old support ($70,000) now acts as resistance
→ Everyone who bought at $70,000 support sells here to exit at breakeven
→ Price gets rejected sharply at $70,000

Short entry on reversal candle at $70,000
Stop: $70,400 (above old support)
Target: $67,500 (previous breakdown low)
This pattern — called a “retest” or “throwback” — offers some of the cleanest, highest R:R entries in technical trading.
Strength of an S/R Level #
Not all S/R levels are equal. These factors determine strength:
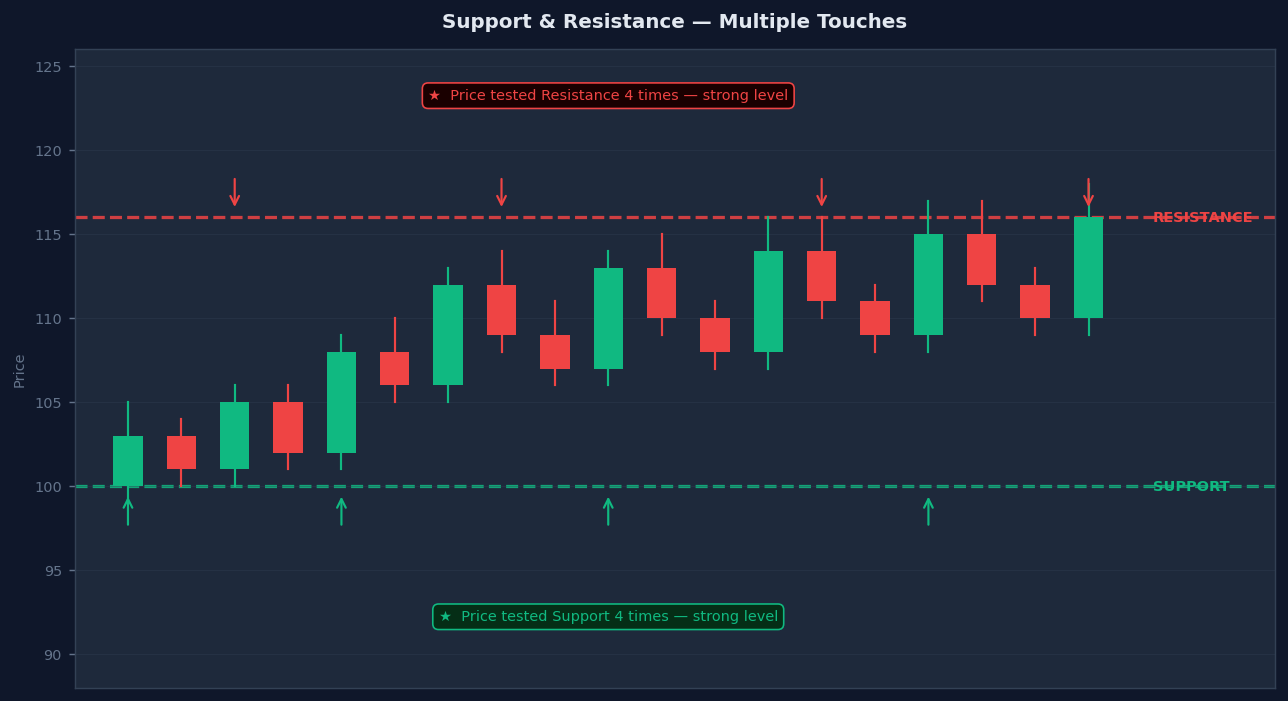
1. Number of Touches #
The more times price has tested a level without breaking it, the more orders are clustered there, and the stronger the level.
| Touches | Strength |
|---|---|
| 1 | Weak — may just be a random high/low |
| 2 | Valid — worth watching |
| 3–4 | Strong — confirmed key level |
| 5+ | Very strong — major level |
2. Timeframe #
A Daily chart support level is far more significant than a 5-minute support level. Larger timeframe = more participants watching it = more orders = stronger reaction.
3. Volume at the Level #
A level where price reversed on high volume = strong institutional participation = high probability of holding again.
4. Time Since Last Test #
A level that held 3 months ago and has not been tested since is “fresh” — orders there may still be active. A level tested daily is “worn out” — orders keep getting absorbed.
5. Clean Price Action at the Level #
Sharp, decisive reversals with clear candlestick patterns = institutions defending the level aggressively. Messy, choppy price action = weak level.
Psychological Levels #
Round numbers have extraordinary magnetic power in markets:
- Bitcoin: $50,000 / $60,000 / $70,000 / $100,000
- Ethereum: $2,000 / $2,500 / $3,000 / $4,000
- Altcoins: Round dollar levels based on ATH and key highs/lows
Why They Work #
Large institutions place bracket orders at round numbers. Retail traders set price alerts at round numbers. Options market makers hedge at strike price round numbers. All of this creates a self-fulfilling concentration of orders.
How to Use Them #
- Add round numbers as additional context alongside your horizontal S/R
- When a strong horizontal S/R level aligns with a round number = extremely high conviction zone
- Round numbers alone (without prior price history) = weaker than history-backed levels
Example: Bitcoin resistance at $70,000
- Historical resistance: Yes (rejected 3 times at this zone)
- Psychological round number: Yes ($70K)
- High options open interest: Yes (options market data)
→ Triple confluence = very high probability resistance
S/R vs Zones vs Lines #
Lines are precise. Zones are realistic.
Markets are not precise. Price often overshoots or undershoots a level by a few points before reversing. If you draw a razor-thin line, you will frequently get stopped out even when you are right.
How to Draw Zones #
Method 1: Body-to-Body Draw one line at the highest body in the area and one line at the lowest body. This captures the range of where candles have repeatedly opened/closed near the level.
Method 2: Swing Point ± ATR Take the swing point and add/subtract a portion of the Average True Range (ATR). For example, if the ATR is 100 points, draw the zone ±30–50 points around the key level.
Method 3: Visual Cluster Where do multiple swing highs/lows cluster? Draw the zone across the cluster range.
Always trade the zone, not the line. Your entry is when price reaches the zone — not an exact pip.
Demand & Supply Zones — Institutional Order Areas #
Demand Zone — A price area where institutional buying was so aggressive that price left sharply to the upside. Unfilled buy orders remain here. When price returns, those orders fill and price rallies again.
Supply Zone — A price area where institutional selling was so aggressive that price left sharply to the downside. Unfilled sell orders remain here. When price returns, those orders fill and price drops again.
The critical difference from S/R: S/R identifies where price reacted before. D/S zones identify where institutional orders were left behind.
Zone Types #
| Type | Name | Meaning |
|---|---|---|
| Drop-Base-Rally (DBR) | Demand Zone | Price drops into a base, then rallies sharply. Base = demand zone. |
| Rally-Base-Drop (RBD) | Supply Zone | Price rallies into a base, then drops sharply. Base = supply zone. |
| Rally-Base-Rally (RBR) | Continuation Demand | Uptrend pullback zone — buy the base in an uptrend. |
| Drop-Base-Drop (DBD) | Continuation Supply | Downtrend pullback zone — short the base in a downtrend. |
How to Draw a Demand Zone #
Step 1: Find a strong impulsive move up — large green candles, minimal consolidation, clear momentum.
Step 2: Identify the base just before the impulse — 1–5 tight candles with overlapping bodies and low range.
Step 3: Draw the zone from the base:
- Top: Highest close of the base candles
- Bottom: Lowest low of the base candles
Step 4: Mark as a green rectangle. Extend forward until price returns and tests the zone.
Bitcoin Example:
Impulse: massive green candle from $61,000 → $64,500
Base (2 candles before): closes at $60,950 and $61,050
Demand Zone: $60,700 – $61,050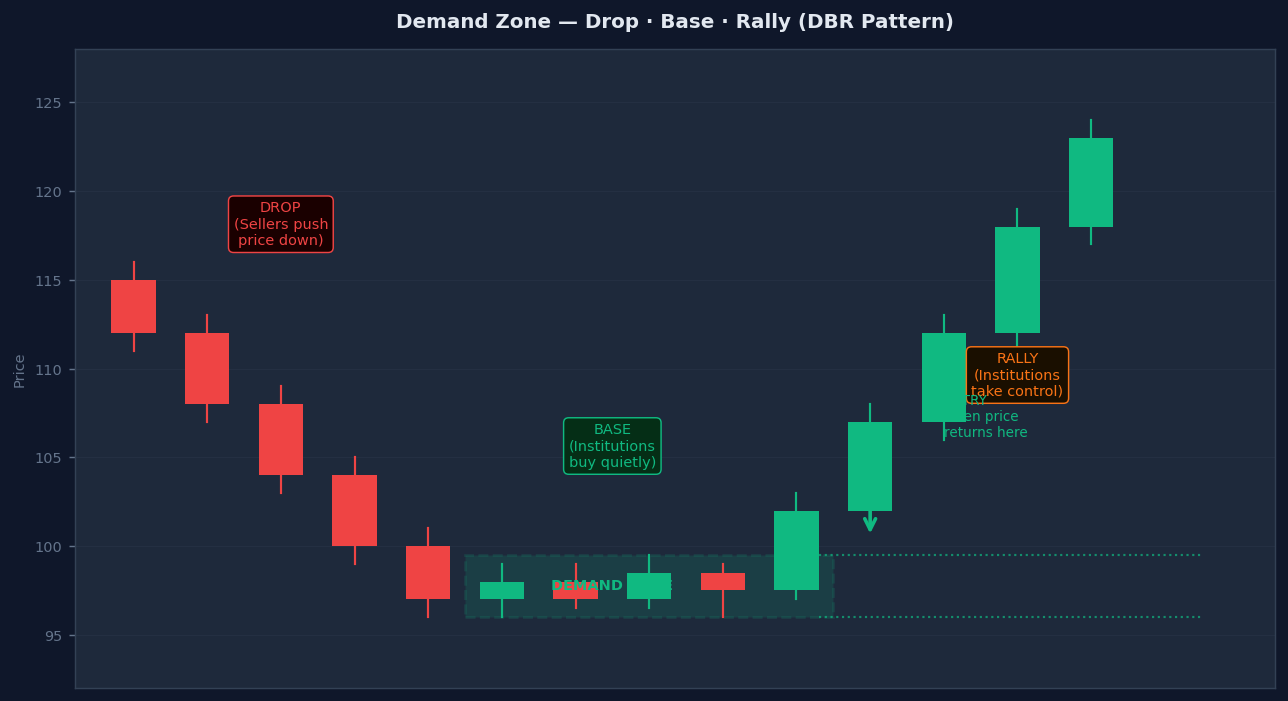
How to Draw a Supply Zone #
Step 1: Find a strong impulsive move down — large red candles, no consolidation during the drop.
Step 2: Identify the base just before the drop — 1–4 small, indecisive candles immediately above the impulse.
Step 3: Draw the zone from the base:
- Top: Highest wick of the base candles
- Bottom: Lowest close of the base candles
Step 4: Mark as a red rectangle. Extend forward until price returns to test the zone.
Bitcoin Example:
Impulse: large red candle from $71,200 → $69,500 ($1,700 drop)
Base (3 candles before): closes at $71,100 / $71,150 / $71,080
Supply Zone: $71,050 – $71,200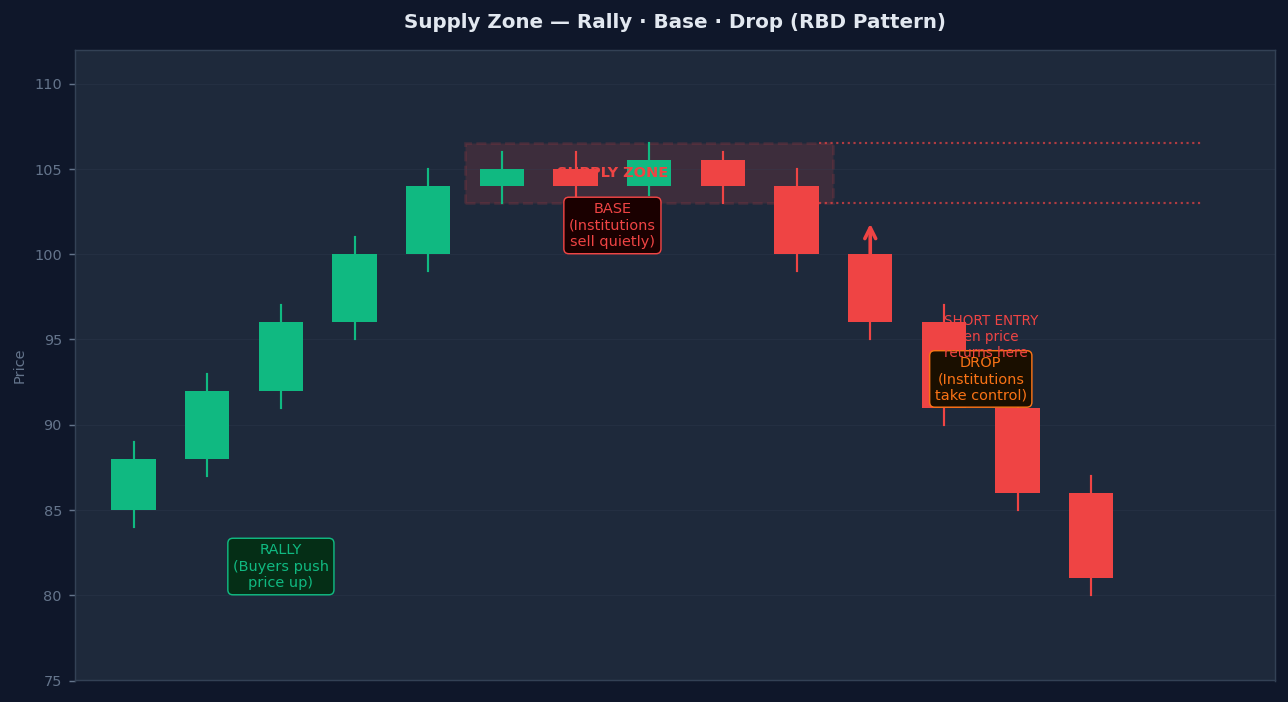
Fresh vs Used Zones #
This is the most important concept in demand/supply zone trading.
Fresh Zone — Price has never returned to this zone after the initial launch. All institutional orders are still pending. First return = highest probability setup.
Used Zone — Price has already returned and reacted once. Some orders filled. Each test weakens the zone:
- 1st test: Strong — most orders still pending
- 2nd test: Moderate — partially consumed
- 3rd+ test: Weak — likely to break through
Rule: Always prefer fresh zones. Reduce size significantly on used zones.
Fresh Zone Example:
Zone at $61,000 formed June 1 → Price ran to $68,000
June 15: Price pulls back toward $61,000 for the FIRST TIME
→ Zone is fresh → High probability long setup

Used Zone Example:
Same zone tested and bounced June 20 (1st use)
Price returns July 5 → Zone is used once → Lower probability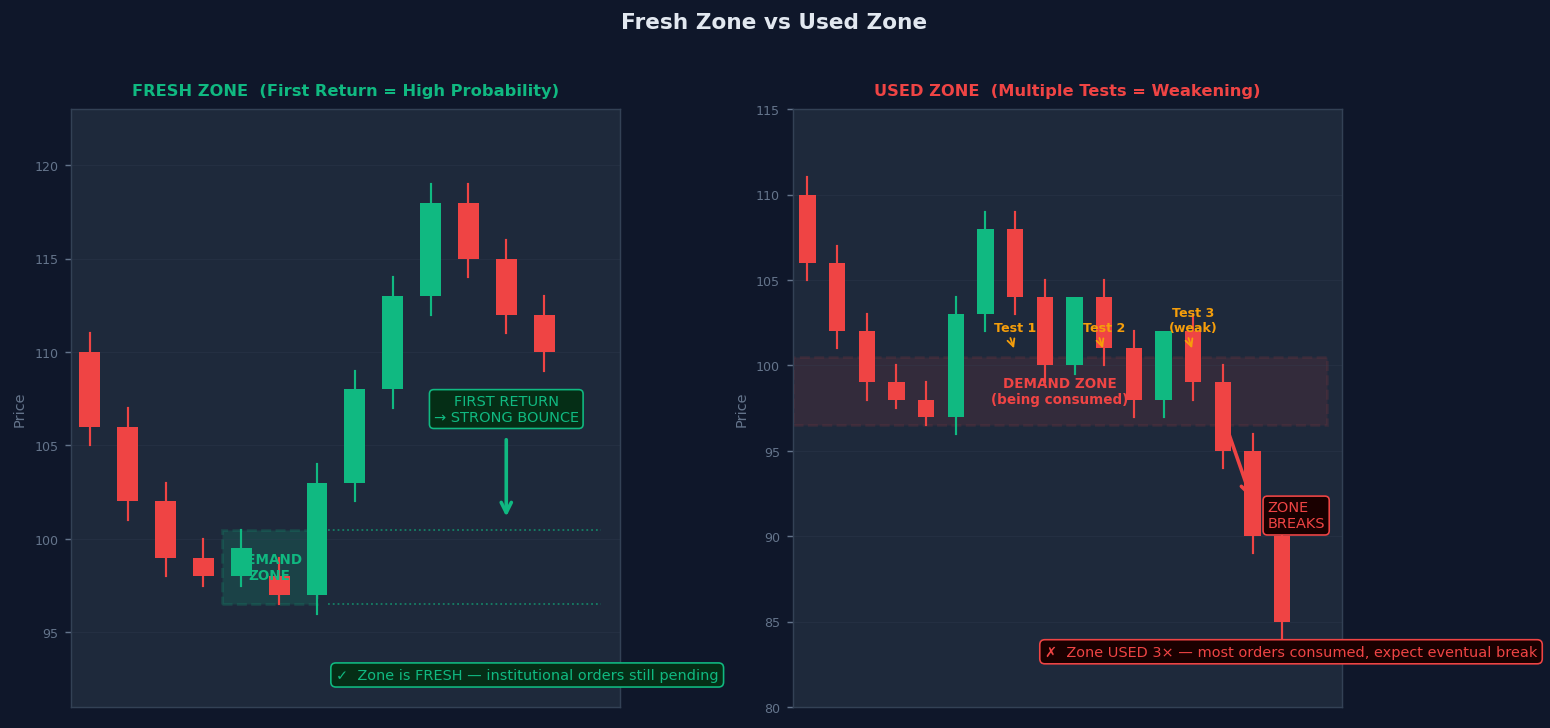
Real Trade Examples #
Short Trade — Role Reversal (S/R Flip) #
Setup: Bitcoin daily chart
Step 1: Bitcoin had a strong support at $70,000 (tested 3 times over 2 months)
Step 2: Price broke below $70,000 with a large red candle on heavy volume
Step 3: Price dropped to $67,500
Step 4: Over the next 5 sessions, price rallied back toward $70,000
Step 5: A bearish engulfing candle formed at $69,950 (at the role-reversal zone)

Short entry: $69,800 (on next candle open)
Stop: $70,300 (above the zone)
Target 1: $68,500 | Target 2: $67,500

Result: Bitcoin sold off to $68,400 over 3 sessions ✓
R:R achieved: 1:2.6
Short Trade — Resistance Rejection #
Setup: Bitcoin 4-hour chart
Step 1: $67,500 had acted as strong resistance (3 rejections over 3 weeks)
Step 2: Each rejection produced a shooting star or bearish engulfing candle
Step 3: Price rallied back to $67,400 on declining volume

Short entry: $67,200 (below the rejection candle's low)
Stop: $67,700 (above the resistance zone)
Target 1: $65,500 (previous swing low)
Target 2: $64,000 (major support)

Result: Bitcoin dropped to $65,300 within 48 hours ✓
R:R achieved: 1:3.8
Multi-Timeframe S/R #
| Timeframe | S/R Type | How to Use |
|---|---|---|
| Monthly/Weekly | Major key levels | Market structure, trend context |
| Daily | Session highs/lows | Medium-term bias, swing trade targets |
| 4-Hour | Swing points | Trend direction, key zone identification |
| 1-Hour | Intraday structure | Entry zone refinement |
| 15-Min / 5-Min | Fine-tune entries | Actual trade entry, stop placement |
The Golden Rule #
Only take entries on the lower timeframe in the direction of the higher timeframe S/R.
If the Daily chart shows clear resistance at 22,500 and price is approaching it, look for short setups on the 15-minute chart near 22,500 — not longs.
Common Mistakes #
1. Drawing too many levels Mark only the 3–5 most obvious levels on any given chart. More lines = more confusion. If you have to look twice to identify a level, other traders cannot see it clearly either — and it matters less.
2. Drawing S/R at wick extremes only Wicks are probes. Bodies are acceptance. Draw your levels primarily at candle bodies where price opened and closed.
3. Treating S/R as exact lines S/R is a zone. Price rarely turns exactly at a line — it enters the zone and the reversal can happen anywhere within it.
4. Ignoring higher timeframe context A support level on a 5-minute chart is far less significant than the same level on a daily chart. Always check what the higher timeframe says before entering.
5. Not waiting for confirmation Entering the moment price touches S/R — without any candlestick confirmation or volume signal — leads to constantly catching falling knives. Wait for the reaction, then enter.
6. Forgetting role reversal Once a strong support breaks, always remark that level as resistance (and vice versa). This is one of the highest-probability setups in all of technical trading.
S/R Trading Checklist #
Drawing the Level #
- Is this level visible on at least the 4-Hour chart or higher?
- Has price tested this level at least twice (ideally 3+ times)?
- Am I drawing a zone (not a razor-thin line)?
- Is the level drawn at candle bodies, not just wick extremes?
- Is this level a role-reversal (old support/resistance)?
Taking the Trade #
- Is there a candlestick reversal pattern at the S/R zone?
- Is volume declining into the S/R (approaching on low volume)?
- Does the higher timeframe trend agree with the trade direction?
- Is my stop placed logically beyond the S/R zone?
- Does the setup offer at least 1:2 risk-reward?
After Entry #
- Set the stop immediately — no exceptions
- Move stop to breakeven once price moves 1R in your favour
- Exit if price closes convincingly through the S/R zone
Final Thoughts #
Support and Resistance is not a system — it is the underlying framework behind every trading system.
Candlestick patterns, indicators, strategies — they all work best when price is at a meaningful S/R level.
Master these fundamentals:
- Draw levels from higher timeframes first
- Treat S/R as zones, not lines
- Always watch for role reversal
- Combine with volume for the highest conviction setups
When a level is clean, obvious, and tested — and price returns to it with declining momentum — that is the highest probability setup in trading. Everything else is just confirmation.
Disclaimer #
This content is for educational purposes only. I am not a financial advisor. Trading involves substantial risk. Past setups do not guarantee future results. Always use proper risk management and do your own research.