Table of Contents #
- What is Price Action Trading
- The Anatomy of a Candlestick
- Reading Candle Strength
- Pin Bar — The Most Powerful Single Candle
- Engulfing Pattern — Momentum Shift
- Inside Bar — The Coiled Spring
- Doji — Market Indecision
- How to Combine Price Action with Key Levels
- Entry, Stop, and Target Rules
- Real Trade Examples
- Common Mistakes
- Price Action Checklist
What is Price Action Trading #
Price action trading means making trading decisions based purely on how price is moving on the chart — without relying on lagging indicators like MACD, RSI, or Stochastics.
Every candlestick tells a story:
- The body shows where price opened and closed (who won the battle)
- The wicks show the extremes price reached (who got rejected)
- The size shows the conviction behind the move
When you combine candlestick reading with key levels (support, resistance, demand zones, VWAP), you have a complete, self-contained trading method used by institutional traders worldwide.
Why Price Action Works #
Indicators are derived from price. They can only tell you what already happened. Price itself is the most leading data available. Learning to read it directly puts you one step ahead of indicator-dependent traders.
Price action is not a strategy. It is the ability to read the language of the market.
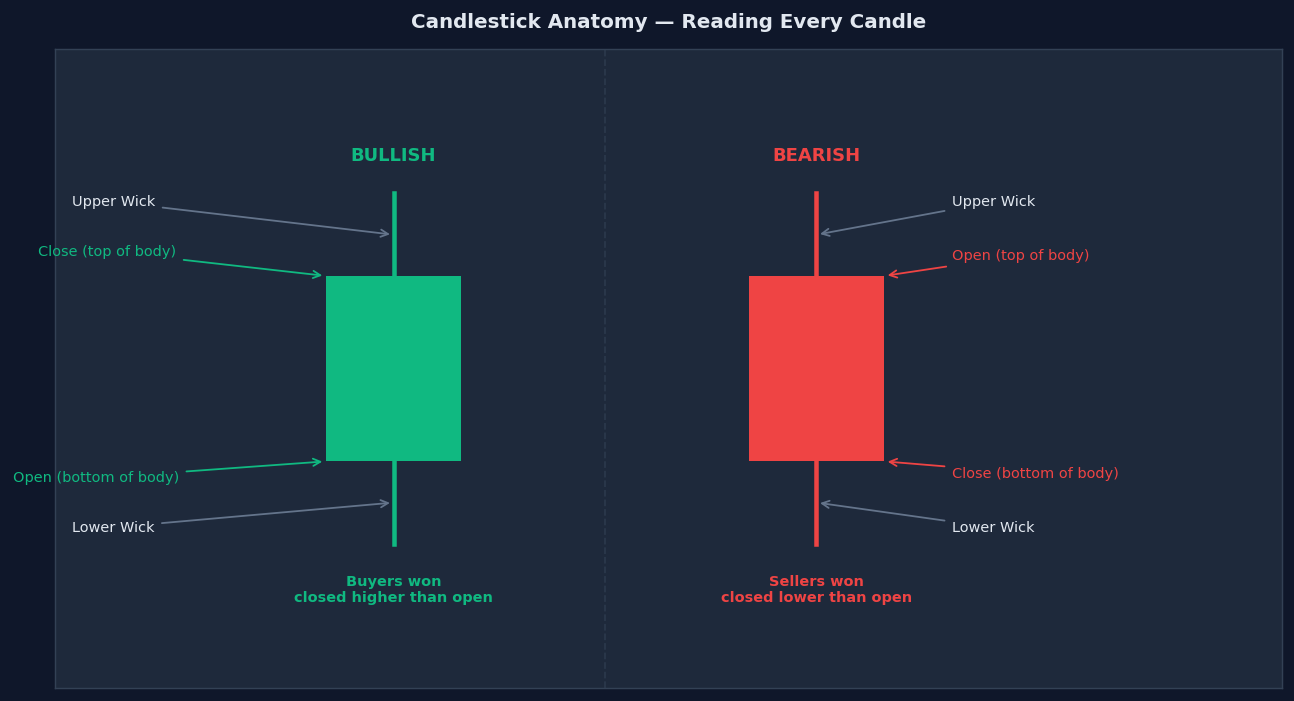
The Anatomy of a Candlestick #
Every candle has four data points: Open, High, Low, Close (OHLC)
       │  ← Upper Wick (High)
     ┌─┴─┐
     │   │ ← Body (distance between Open and Close)
     └─┬─┘
       │  ← Lower Wick (Low)
Bullish Candle (Green) #
- Open at the BOTTOM of the body
- Close at the TOP of the body
- Buyers pushed price higher — closed above where it opened
- The larger the body, the stronger the buying pressure
Bearish Candle (Red) #
- Open at the TOP of the body
- Close at the BOTTOM of the body
- Sellers pushed price lower — closed below where it opened
- The larger the body, the stronger the selling pressure
What Wicks Tell You #
- Long upper wick on a bullish candle → buyers tried to push higher but sellers rejected it at the top
- Long lower wick on a bearish candle → sellers tried to push lower but buyers rejected it at the bottom
- Very short or no wick (Marubozu) → one side had complete control for the entire candle
Reading Candle Strength #
Before trading any pattern, first assess the strength of the individual candles you see.
Strong Candles #
- Large body relative to recent candles
- Small or no wicks (decisive move — no rejection)
- Close near the high (bullish) or low (bearish) of the candle
- Higher-than-average volume
Weak Candles #
- Small body (indecision, balance between buyers and sellers)
- Large wicks relative to body (rejection at extremes)
- Close near the middle of the candle’s range
- Lower-than-average volume
Candle Size Context #
Always compare a candle to the average candle size in that area. A “large” candle on a chart with normally small candles is a strong signal. The same candle on a chart with even larger candles is not as significant.
| Candle Type | Meaning | Action |
|---|---|---|
| Large bullish body, no wick | Buyers in full control | Trend continuation long |
| Large bearish body, no wick | Sellers in full control | Trend continuation short |
| Small body, large wicks | Indecision | Wait — no clear winner |
| Large wick on one side only | Strong rejection of that direction | Reversal possible |
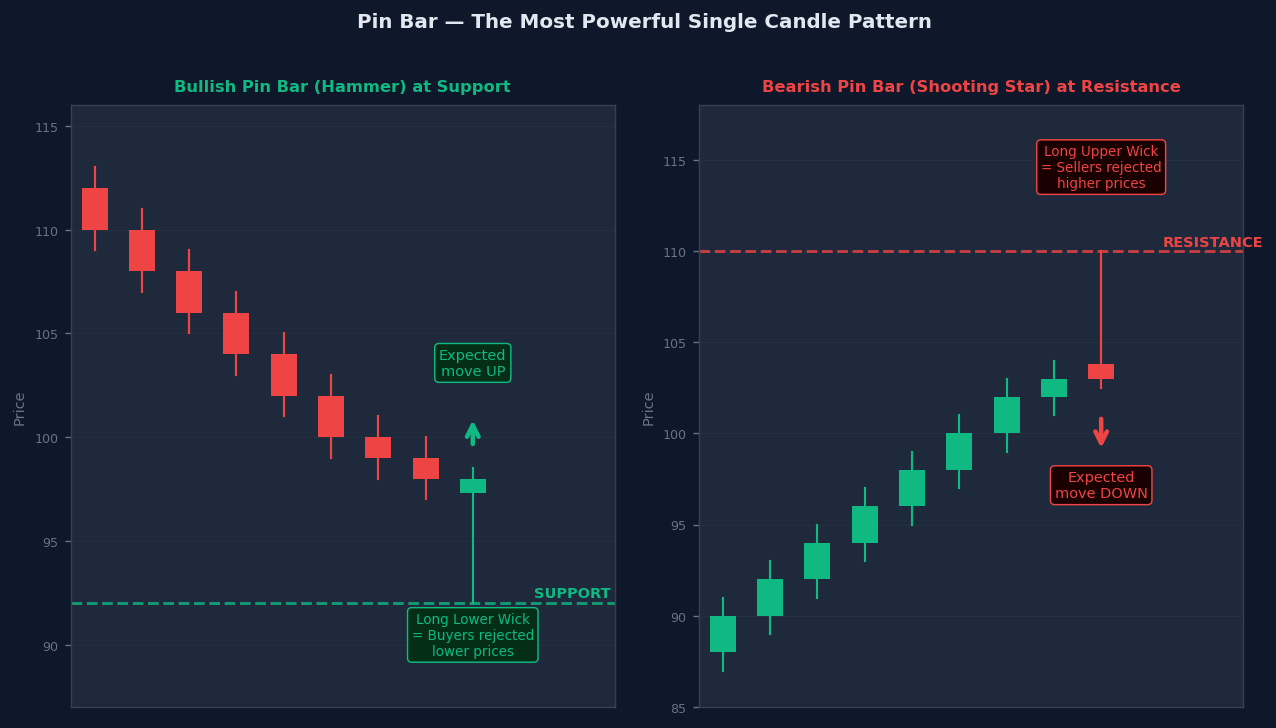
Pin Bar — The Most Powerful Single Candle #
A Pin Bar (also called a hammer or shooting star depending on context) is a single candle with:
- A very long wick on one side (at least 2/3 of the total candle range)
- A small body at the opposite end
- A short or no wick on the body side
The long wick tells you price was aggressively rejected from that extreme. Buyers or sellers overpowered the opposing side and pushed price back.
Bullish Pin Bar (Hammer) #
- Long lower wick, small body at the top
- Appears at support levels, demand zones, or after a downtrend
- Meaning: sellers pushed price lower, but buyers stepped in hard and drove it back up
- Signal: potential reversal upward
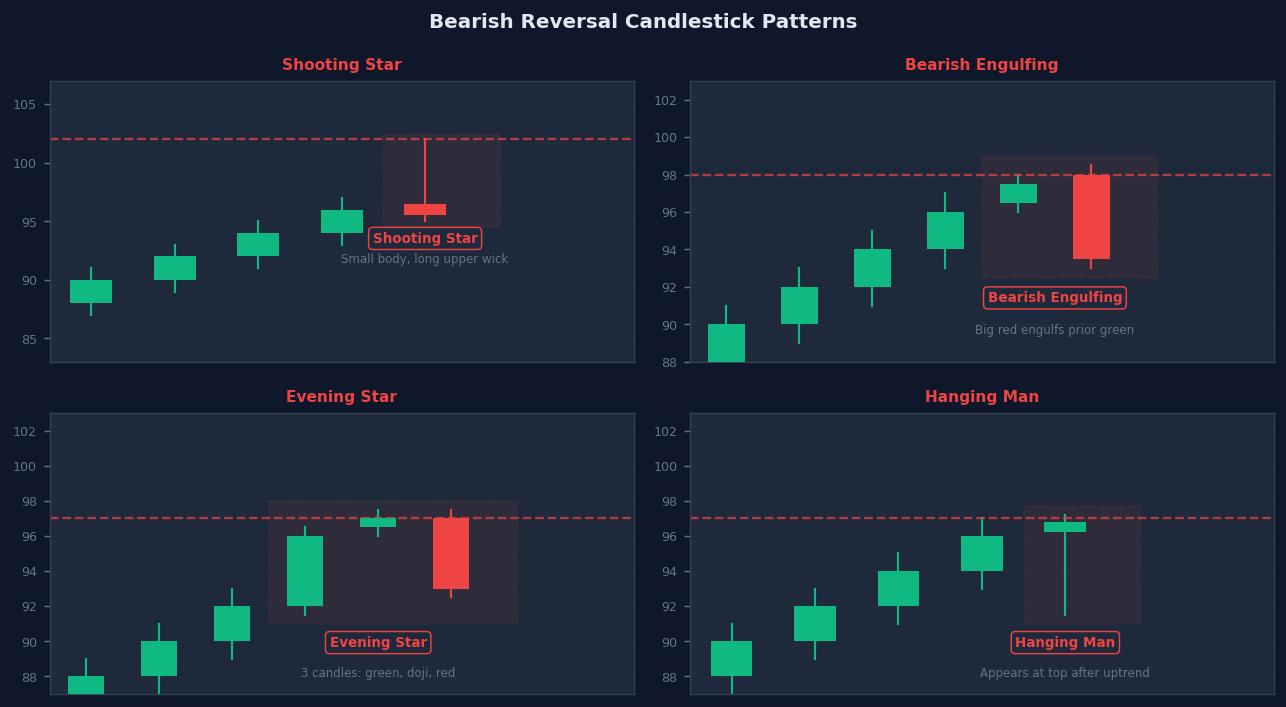
Bearish Pin Bar (Shooting Star) #
- Long upper wick, small body at the bottom
- Appears at resistance levels, supply zones, or after an uptrend
- Meaning: buyers pushed price higher, but sellers stepped in hard and drove it back down
- Signal: potential reversal downward
Entry Rules for Pin Bar #
Bullish Pin Bar:
Entry:  Above the pin bar high (on the next candle)
Stop:   Below the pin bar low (below the wick)
Target: Next key resistance level

Example — Bitcoin:
Pin bar forms at support zone $69,500 with long lower wick to $69,000
Entry: $69,700 (above pin high) | Stop: $68,800 | Target: $71,000
R:R = 1:1.7+
What Makes a High-Quality Pin Bar #
- Forms at a key level (S/R, demand zone, VWAP, POC — Point of Control from Volume Profile)
- The wick is unusually long compared to surrounding candles
- Body is in the top/bottom third of the total range
- The wick points INTO the key level (the rejection is at the level itself)
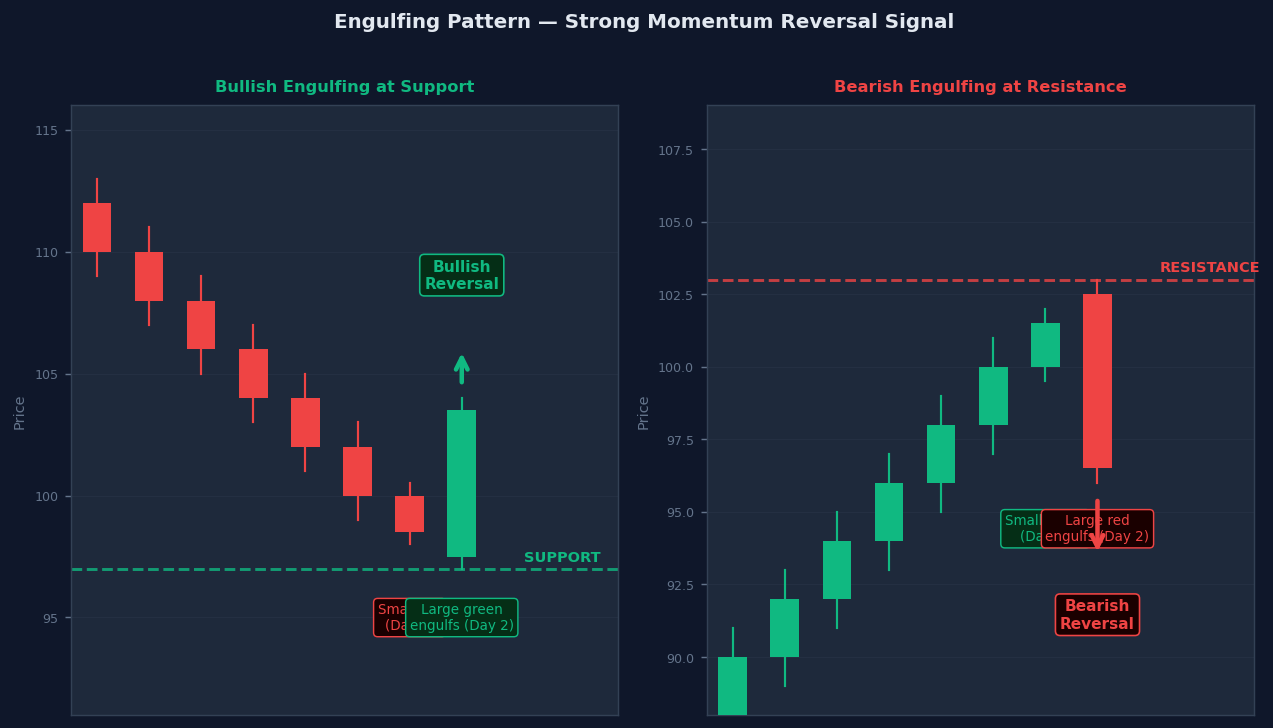
Engulfing Pattern — Momentum Shift #
An Engulfing Pattern is a two-candle formation where the second candle’s body completely engulfs the first candle’s body (open to close).
It signals a decisive shift in momentum from one side to the other.
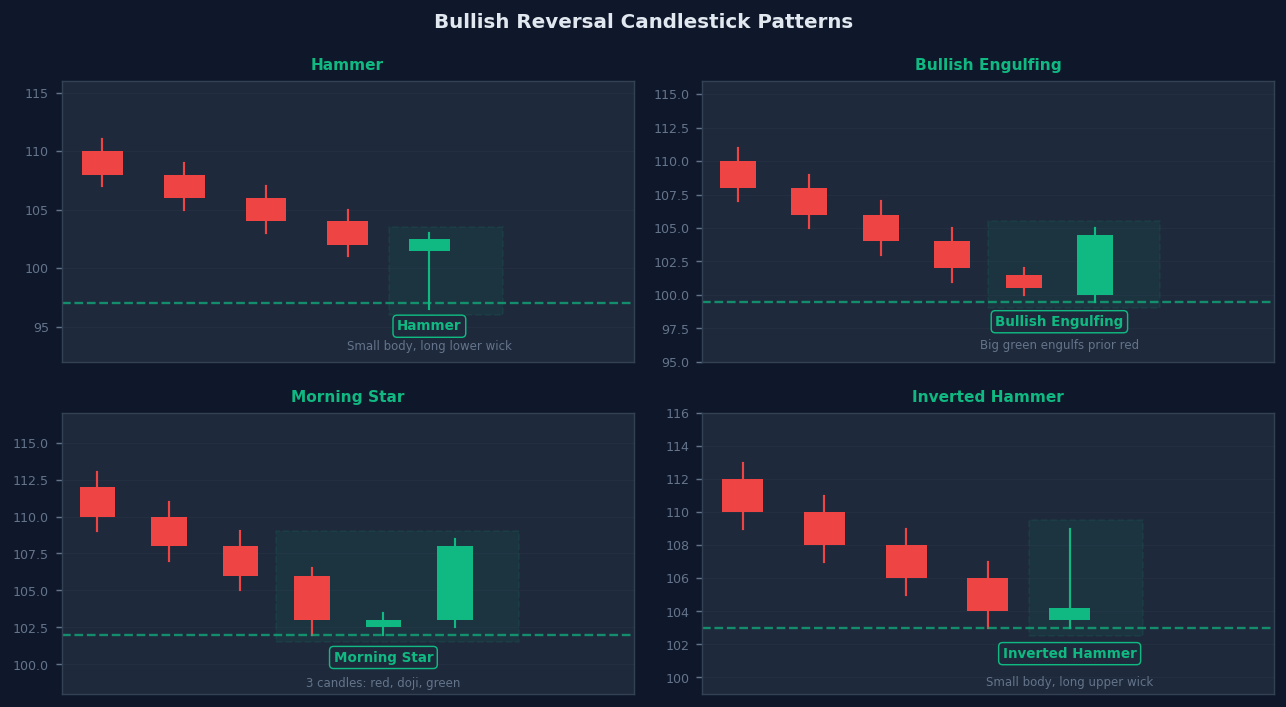
Bullish Engulfing #
- Candle 1: Small bearish (red) candle
- Candle 2: Large bullish (green) candle whose body completely covers candle 1’s body
- Meaning: Sellers pushed price down on day 1, but buyers came in with such force on day 2 that they overwhelmed the entire day 1 move
- Signal: Bullish reversal or continuation of uptrend
Bearish Engulfing #
- Candle 1: Small bullish (green) candle
- Candle 2: Large bearish (red) candle whose body completely covers candle 1’s body
- Meaning: Buyers pushed price up on day 1, but sellers overwhelmed the entire move on day 2
- Signal: Bearish reversal or continuation of downtrend
Entry Rules for Engulfing #
Bullish Engulfing Entry:
Entry:  Above the engulfing candle high (on the next candle open)
Stop:   Below the engulfing candle low (below the low of candle 2)
Target: Next key resistance level

Real Example — Bitcoin Daily:
At support zone $68,500, a small red candle forms (candle 1)
Next day: large green candle opens at $68,450, closes at $70,200 — engulfs candle 1 completely
Entry: $70,300 | Stop: $68,100 | Target: $73,000
Key Rule: Context Matters #
An engulfing candle at a random location is weak. An engulfing candle at a:
- Key support/resistance level
- Demand or supply zone
- VWAP or Volume Profile POC
- Fibonacci golden zone
…is a high conviction setup.
Inside Bar — The Coiled Spring #
An Inside Bar is a candle whose entire range (high to low) fits inside the previous candle’s range (high to low). The previous larger candle is called the “Mother Bar.”
What It Means #
The market is pausing. After a strong move (the Mother Bar), price contracts into a tight range. This represents indecision — neither buyers nor sellers are taking control.
But that indecision is temporary. The coiled energy often releases as a strong breakout in one direction.
How to Trade the Inside Bar #
Breakout Method (trend-following):
In an uptrend, price makes a strong bullish Mother Bar
Inside Bar forms the next candle
Entry: Buy when price breaks above the Inside Bar high
Stop: Below the Mother Bar low
Target: Next key resistance

Example — Bitcoin 4H:
Mother Bar: strong green candle from $64,000 to $66,500
Inside Bar: entire range stays between $65,200–$66,300
Price breaks above $66,300 → Breakout entry
Stop: $63,800 (below Mother Bar) | Target: $69,500
Fade Method (counter-trend at extremes): Used at key resistance/support when the breakout is expected to fail. Less common — requires more experience.
Inside Bar Quality Criteria #
- Mother Bar should be a strong, decisive candle (not a doji)
- Inside Bar should be significantly smaller than the Mother Bar
- Inside Bars that form at key levels have the highest probability
- Multiple consecutive inside bars = even more compressed energy = stronger eventual breakout
Doji — Market Indecision #
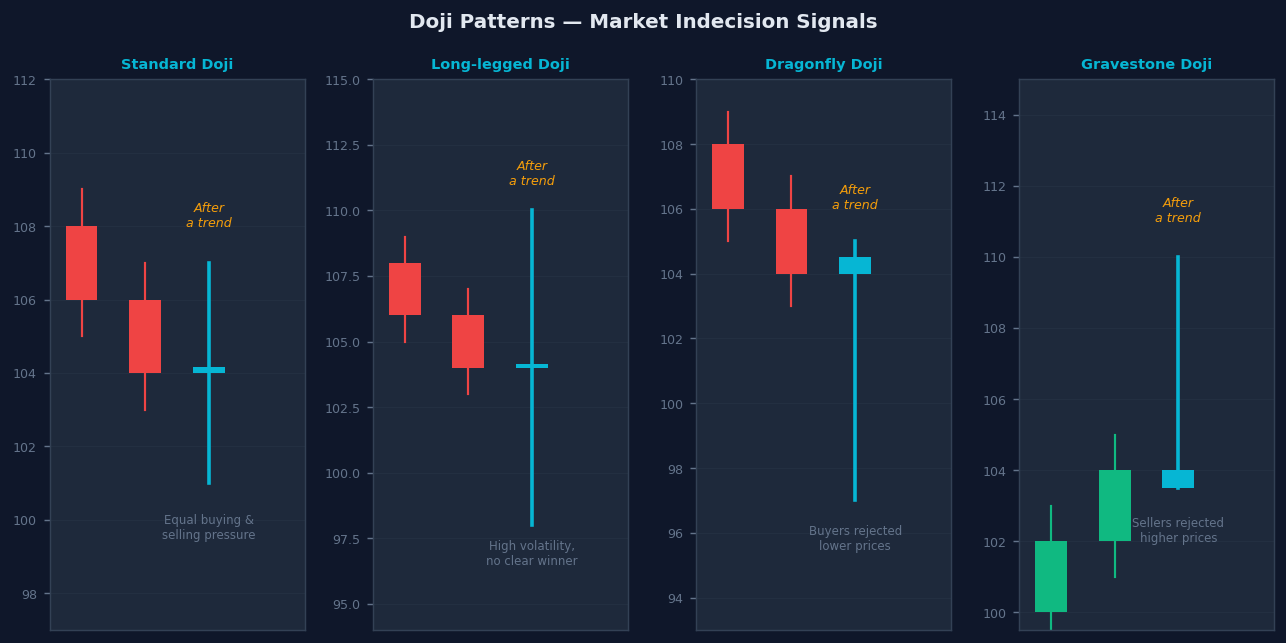
A Doji is a candle where the open and close are nearly the same price, resulting in a very small or nonexistent body. The candle’s story: buyers and sellers fought all session and ended exactly where they started.
Types of Doji #
Standard Doji — open ≈ close, wicks roughly equal on both sides → Pure indecision. Wait for the next candle to determine direction.
Long-Legged Doji — very long wicks on both sides, tiny body in the middle → Extreme indecision. High volatility session with no winner. Expect a directional move next.
Dragonfly Doji — open ≈ close ≈ high (tiny upper wick), long lower wick → Bullish signal at support. Sellers tried to push price down but buyers completely recovered.
Gravestone Doji — open ≈ close ≈ low (tiny lower wick), long upper wick → Bearish signal at resistance. Buyers tried to push price up but sellers completely rejected it.
How to Trade Doji #
A Doji alone is not a trade signal. It becomes a signal when it appears:
- At a key support level (especially Dragonfly Doji → bullish)
- At a key resistance level (especially Gravestone Doji → bearish)
- After a prolonged trend (potential exhaustion signal)
The candle after the Doji confirms the direction. Trade in the direction of the confirmation candle.
Combining Price Action with Key Levels #
This is the core of professional price action trading:
Price action pattern + Key level = High probability trade
A pin bar alone is just interesting. A pin bar at a major support zone that has held 3 times, aligned with VWAP, at the 0.618 Fibonacci level — that is a high conviction setup worth risking capital on.
The Confluence Framework #
Build a checklist before any price action trade:
- Key level: Is the pattern forming at a meaningful price level?
- Trend alignment: Is the signal in the direction of the higher timeframe trend?
- Pattern quality: Is the pin bar / engulfing / inside bar a clean, clear formation?
- Volume: Is volume declining into the level (confirming weak pressure) and picking up on the signal candle?
- Multiple confirmations: Does any other tool (VWAP, Volume Profile POC, demand zone) align with this level?
Score 4–5 out of 5 = trade it Score 2–3 = reduce size or skip Score 0–1 = do not trade
Entry, Stop, and Target Rules #
| Pattern | Entry Trigger | Stop Placement | Target |
|---|---|---|---|
| Bullish Pin Bar | Above pin high (next candle) | Below pin low (full wick) | Next key resistance |
| Bearish Pin Bar | Below pin low (next candle) | Above pin high (full wick) | Next key support |
| Bullish Engulfing | Above engulfing high | Below engulfing low | Next resistance |
| Bearish Engulfing | Below engulfing low | Above engulfing high | Next support |
| Inside Bar Breakout | Above/below inside bar | Beyond Mother Bar extreme | Next key level |
| Doji Confirmation | Above/below confirmation candle | Beyond doji extreme + buffer | Next key level |
Stop Loss Sizing Rule #
Always place the stop beyond the signal candle’s extreme — not at the extreme, slightly beyond it (0.2–0.3% for crypto). This absorbs normal market noise without giving up too much risk.
Minimum R:R #
Never take a price action trade that offers less than 1:2 risk-reward. If the nearest key level as a target only gives you 1:1, skip the trade and wait for a better opportunity.
Real Trade Examples #
Long — Pin Bar at Support (Bitcoin 15M) #
Context: Bitcoin in uptrend on daily. 15M pullback underway.
Key level: $69,800 (previous swing low + demand zone)

Signal: At $69,800, a hammer candle forms:
  - Open: $69,830 | Close: $69,850
  - High: $69,870 | Low: $69,400 (long lower wick)
  - Lower wick is 3.5× the body length → strong rejection

Entry:  $69,900 (above pin bar high)
Stop:   $69,300 (below pin bar low — full wick)
Target: $71,200 (next HH zone)

Risk:   $600 | Reward: $1,300 | R:R = 1:2.17

Result: Bitcoin rallied to $71,100 over the next 4 hours ✓
Short — Bearish Engulfing at Resistance (Bitcoin 1H) #
Context: Bitcoin in downtrend on 4H. Small 1H rally to LH zone.
Key level: $65,500 (previous breakdown level, now resistance)

Signal: At $65,500:
  Candle 1: Small green candle — Open $65,200, Close $65,480
  Candle 2: Large red candle — Open $65,490, Close $64,820 (full engulf)
  Volume on candle 2 = 2.8× average → institutional selling

Entry:  $64,780 (below engulfing candle low)
Stop:   $65,620 (above resistance + small buffer)
Target: $63,000 (next demand zone)

Risk:   $840 | Reward: $1,780 | R:R = 1:2.12

Result: Bitcoin dropped to $62,900 over next 18 hours ✓
Common Mistakes #
1. Trading patterns without key level context A pin bar in the middle of empty space is not a trade. Context is everything. Always ask: “why would price reverse here?” If there is no structural reason, skip it.
2. Entering on pattern recognition, not confirmation Waiting for the signal candle to fully close before entering is non-negotiable. A candle that looks like a pin bar at 80% completion can turn into a large engulfing candle. Only trade closed candles.
3. Using too tight a stop Placing stops inside the signal candle’s range (e.g., at the body midpoint) leads to constant stop-outs on normal market noise. The stop must clear the full candle extreme.
4. Chasing patterns on low timeframes with no HTF alignment A beautiful engulfing pattern on the 1M chart inside a daily downtrend is a losing trade. Minimum: the signal timeframe and one higher timeframe must agree.
5. Over-trading by forcing patterns onto every candle Price action setups are relatively rare. You should see 2–4 quality setups per session on a well-chosen market, not 15–20. If you are finding patterns everywhere, you are seeing what you want to see, not what is there.
Price Action Trading Checklist #
Before Any Price Action Trade #
- Is the pattern forming at a clearly defined key level?
- Is the higher timeframe trend aligned with the trade direction?
- Is the signal candle fully CLOSED (not still forming)?
- Is the pattern clean and obvious (would someone else see it too)?
Signal Quality Check #
- Is the wick (pin bar) or body (engulfing) significantly larger than the surrounding candles?
- Is there declining volume on the move INTO the level?
- Is there any additional confluence (VWAP, VP POC, demand zone, Fibonacci)?
Trade Execution #
- Entry: Above/below the signal candle extreme (next candle)
- Stop: Beyond the full signal candle range + small buffer
- Target: The next meaningful key level
- R:R minimum: 1:2 before entering
Final Thoughts #
Price action is both the simplest and most powerful approach to trading.
There are no magical combinations of indicators to find. There is no perfect algorithm. There is just price — where it is, where it has been, and what the current candles tell you about who is winning between buyers and sellers.
Master the fundamentals:
- Read every candle (body vs wick, size, context)
- Identify the three key patterns: Pin Bar, Engulfing, Inside Bar
- Only trade them at meaningful key levels
- Align with the higher timeframe trend
The market will always give you setups. Your job is to be patient, selective, and disciplined enough to wait for the ones with genuine confluence.
Disclaimer #
This content is for educational purposes only. I am not a financial advisor. Trading involves substantial risk. Past setups do not guarantee future results. Always use proper risk management.