Table of Contents #
- What is Order Flow Trading
- What is a Footprint Chart
- Reading Bid/Ask Volume
- Point of Control (POC)
- Delta — The Most Important Number
- Bid/Ask Imbalances
- Stacked Imbalances
- Cumulative Delta Divergence
- How to Trade With Order Flow
- Real Trade Examples
- Common Mistakes
- Order Flow Checklist
What is Order Flow Trading #
Order flow trading means reading the actual buy and sell orders being executed in the market — not indicators derived from price, but the raw transactional data itself.
Every trade that happens in the market is either:
- A buyer lifting the ask (aggressive buying — someone wanted in NOW)
- A seller hitting the bid (aggressive selling — someone wanted out NOW)
These aggressive participants move price. Passive limit orders sit and wait; aggressive market orders cause the actual price movement.
When you can see exactly how much aggressive buying and selling happened at each price level — you have a massive edge over traders who only look at the candlestick close.
Why This Matters #
A bullish candle can close green even when sellers are dominant. A large green candle with 80% sell volume at the top is a distribution candle, not accumulation. Without order flow, you would read it as bullish. With order flow, you see the trap being set.
Order flow is the only tool that shows you what is happening inside the candle, not just where it ended up.
What is a Footprint Chart #
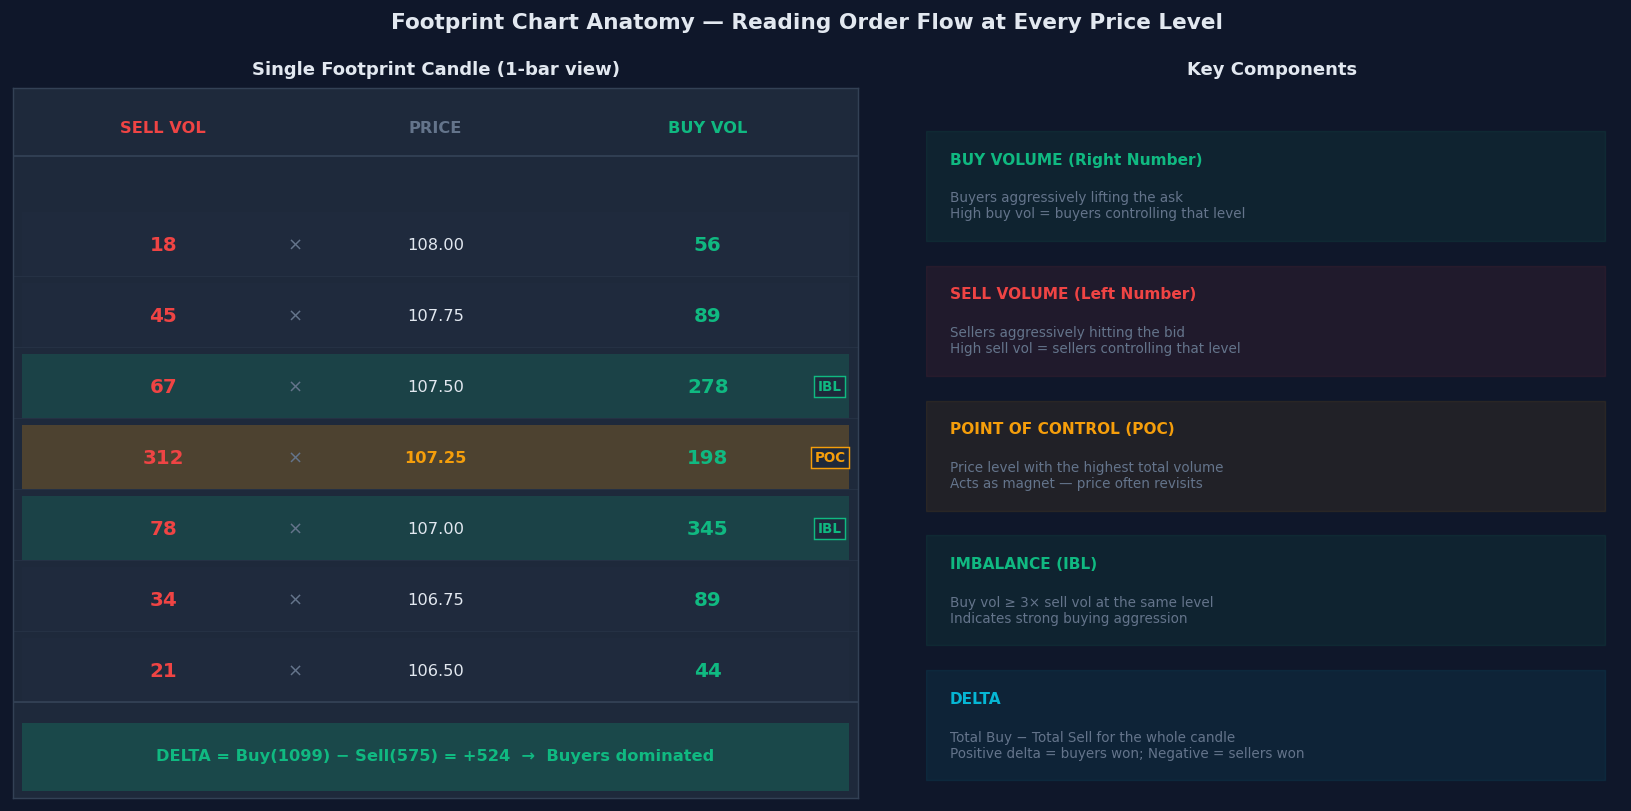
A footprint chart (also called a bid/ask chart or order flow chart) displays the volume traded at every price level inside each candle, split into:
- Left number — Sell volume (sellers hitting the bid aggressively)
- Right number — Buy volume (buyers lifting the ask aggressively)
Instead of a plain green or red candle, you see a grid of numbers at every price tick, showing exactly where the fight happened and who won at each level.
What You Can Read From a Footprint #
- Which price levels had the most activity (Point of Control)
- Whether buyers or sellers were more aggressive at each level
- Where price was rejected hard (high sell vol at tops, high buy vol at bottoms)
- Whether a move had conviction behind it (imbalances) or was just noise
Reading Bid/Ask Volume #
The Two Numbers at Each Price Level #
At every price level inside a footprint candle, you see two numbers:
SELL × BUY
 45  × 312   ← Buyers massively dominated at this level
312  × 89    ← Sellers dominated at this level (POC in this example)
 67  × 278   ← Buyers dominated again
What Each Side Tells You #
High Buy Volume at a Level:
- Buyers were aggressively lifting the ask
- They were willing to pay any price to get in immediately
- Indicates strong demand at that price
- Bullish signal when clustered at lows or support
High Sell Volume at a Level:
- Sellers were aggressively hitting the bid
- They were willing to sell at any price to get out immediately
- Indicates strong supply at that price
- Bearish signal when clustered at highs or resistance
Candle Context Still Matters #
A single number at one price level means nothing without context. Look at:
- Where on the chart is this candle? (key level, trend direction)
- What is the overall delta for this candle? (net buyer vs seller)
- Are there multiple consecutive levels showing the same imbalance?
Point of Control (POC) #
The Point of Control (POC) is the price level inside a candle (or a session) where the most total volume was traded.
Why POC Matters #
The POC is where the most agreement between buyers and sellers occurred — the “fair price” for that period. Price has a strong tendency to:
- Return to the POC after moving away from it (like a magnet)
- Respect the POC as support or resistance on subsequent visits
Trading the POC #
Scenario 1 — POC as Support:
Price makes a bullish candle. POC is at 107.25.
Price later pulls back to 107.25 → High probability long entry
Stop below POC | Target: previous high

Scenario 2 — POC as Resistance:
Price in downtrend. Previous session POC at 112.50.
Price rallies to 112.50 → High probability short entry
Stop above POC | Target: next swing low
Session POC vs Composite POC #
- Session POC — the highest volume price for one trading session (day)
- Composite POC — the highest volume price across multiple sessions
- Composite POC levels carry more weight as they represent multi-day institutional interest
Delta — The Most Important Number #
Delta is the difference between total buy volume and total sell volume for a candle:
Delta = Total Buy Volume − Total Sell Volume

Positive Delta (+412) → Buyers were more aggressive → Bullish candle
Negative Delta (−289) → Sellers were more aggressive → Bearish candle
Why Delta Is More Powerful Than the Candle Colour #
A green candle can have negative delta — price closed higher but sellers were actually more aggressive. This is bearish. Absorption is happening — smart money is quietly distributing while retail buyers push price up.
A red candle can have positive delta — price closed lower but buyers were actually more aggressive. This is bullish. Selling pressure is being absorbed by institutional buying.
Delta Signals to Watch #
| Delta vs Price | Meaning |
|---|---|
| Large positive delta, price up | Strong bullish — buyers in full control |
| Large positive delta, price flat/down | Bearish absorption — sellers absorbing buying |
| Large negative delta, price down | Strong bearish — sellers in full control |
| Large negative delta, price flat/up | Bullish absorption — buyers absorbing selling |
Bid/Ask Imbalances #
A bid/ask imbalance occurs when the volume on one side at a price level is 3× or more than the other side:
Buy Imbalance:  sell 45 × buy 312  → Buy is 6.9× the sell → Strong buying at this level
Sell Imbalance: sell 234 × buy 67  → Sell is 3.5× the buy → Strong selling at this level
What Imbalances Tell You #
Buy imbalance at a low → Buyers are aggressively defending that price level. Strong support.
Sell imbalance at a high → Sellers are aggressively defending that price level. Strong resistance.
Imbalance rule of thumb: Buy volume at least 3× sell volume (or sell at least 3× buy) for a meaningful signal.
Diagonal Imbalances #
Some platforms also show diagonal imbalances — comparing the ask at one level to the bid at the level above it. When the ask at level X is much larger than the bid at level X+1, it signals buyers had to absorb heavy supply to push price up. This often precedes a reversal.
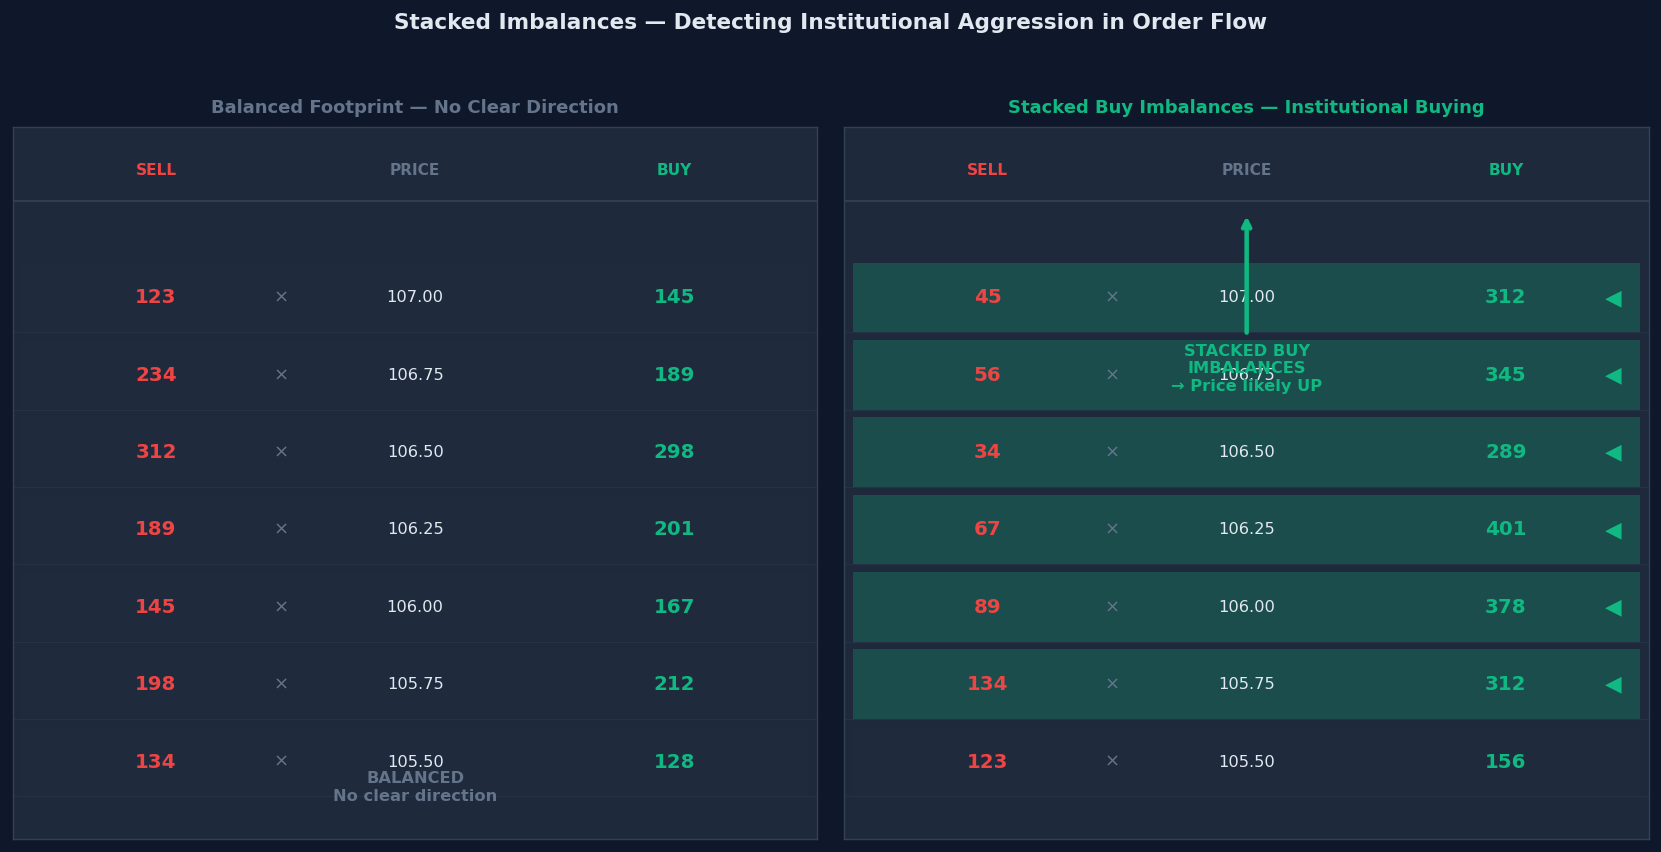
Stacked Imbalances #
Stacked imbalances occur when multiple consecutive price levels within the same candle all show imbalances in the same direction.
- Stacked buy imbalances — 3 or more consecutive levels where buy vol » sell vol
- Stacked sell imbalances — 3 or more consecutive levels where sell vol » buy vol
Stacked imbalances are one of the strongest order flow signals. They show institutional aggression — a large buyer or seller systematically sweeping through multiple price levels without hesitation.
How to Trade Stacked Imbalances #
Stacked Buy Imbalances (Long Setup):
Location: At a support level, demand zone, or VWAP
Signal:   3+ consecutive levels with buy vol ≥ 3× sell vol
Entry:    Above the imbalance candle high
Stop:     Below the lowest imbalance level
Target:   Next key resistance level

Stacked Sell Imbalances (Short Setup):
Location: At a resistance level, supply zone, or VWAP
Signal:   3+ consecutive levels with sell vol ≥ 3× buy vol
Entry:    Below the imbalance candle low
Stop:     Above the highest imbalance level
Target:   Next key support level
Cumulative Delta Divergence #
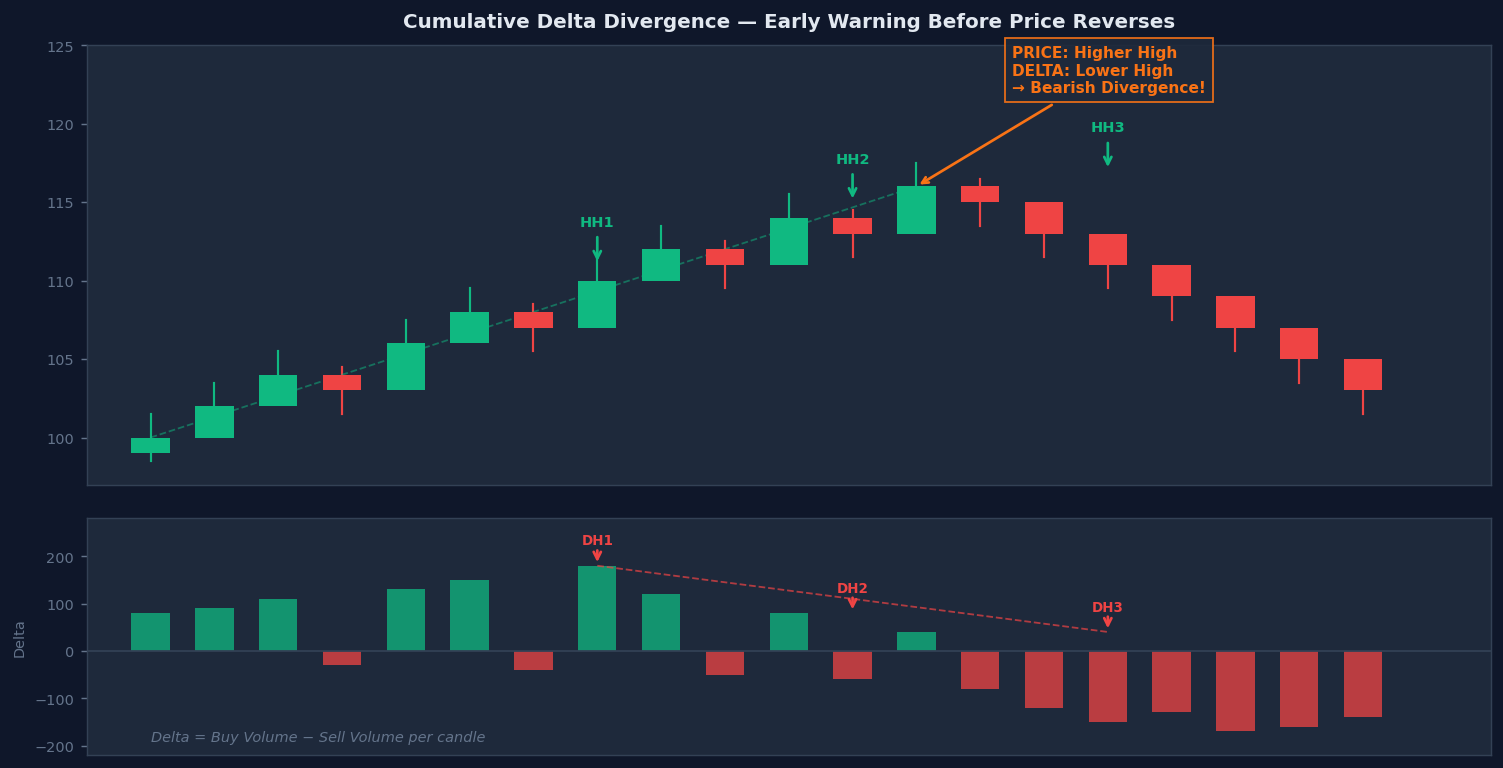
Cumulative delta is the running total of delta across multiple candles. When price and cumulative delta start moving in opposite directions, a divergence forms — and it almost always precedes a reversal.
Bearish Divergence (Most Powerful) #
- Price makes Higher Highs
- Cumulative delta makes Lower Highs
- Buyers are pushing price up, but fewer and fewer buyers are participating
- Sellers are slowly taking over → Reversal imminent
Bullish Divergence #
- Price makes Lower Lows
- Cumulative delta makes Higher Lows
- Sellers pushing price down, but delta is rising → Buyers absorbing selling → Reversal imminent
How to Trade With Order Flow #
Order flow is most powerful as a confirmation tool — use it to confirm or reject setups you already identify from price action, key levels, and market structure.
The Order Flow Confirmation Framework #
Step 1: Identify a key level using standard price action (support, resistance, demand/supply zone, VWAP).
Step 2: When price arrives at the level, open the footprint chart and look for:
- High buy volume at support (buyers defending the level)
- High sell volume at resistance (sellers defending the level)
- Delta turning positive at support or negative at resistance
- Stacked imbalances in the expected direction
Step 3: Confirm with cumulative delta — is delta diverging from price? Are delta lows rising (bullish) while price lows are flat (potential bounce)?
Step 4: Enter in the direction the order flow confirms. Use the footprint’s imbalance zone as your stop reference.
The 3-Step Filter #
1. Key Level    → Is price at support/resistance/demand/supply?
2. Delta Signal → Is delta confirming the expected direction?
3. Imbalance    → Are there stacked imbalances in the entry direction?

All 3 present = High confidence entry
2 of 3 present = Proceed with reduced size
1 or fewer = Do not enter
Real Trade Examples #
Long — Stacked Buy Imbalances at Demand Zone (Bitcoin 5M) #
Context: Bitcoin in uptrend on hourly. 5M pullback to 64,800 demand zone.

Footprint at 64,800:
  Level 64,850 | Sell: 45  × Buy: 312  ← Imbalance
  Level 64,825 | Sell: 56  × Buy: 345  ← Imbalance
  Level 64,800 | Sell: 34  × Buy: 289  ← Imbalance
  Level 64,775 | Sell: 67  × Buy: 401  ← Imbalance (4 stacked!)
  Candle Delta: +1,188 (strong bullish)

Signal:  4 consecutive buy imbalances at demand zone
Entry:   $64,920 (above imbalance candle high)
Stop:    $64,650 (below lowest imbalance level)
Target:  $66,200 (previous swing high)

Risk: $270 | Reward: $1,280 | R:R = 1:4.7
Result: Bitcoin rallied to $66,100 over next 3 hours ✓
Short — Negative Delta Divergence at Resistance (Bitcoin 15M) #
Context: Bitcoin approaches $70,500 resistance. Price makes 3 pushes higher.

Cumulative Delta at each high:
  Push 1 to $70,480: Delta = +2,340
  Push 2 to $70,510: Delta = +1,120  ← Lower delta high
  Push 3 to $70,490: Delta = +340    ← Much lower delta high

Divergence confirmed: Price making higher highs, delta making lower highs.
Buyers running out of steam at resistance.

Trigger: Bearish engulfing candle with negative delta (−1,800) at $70,500

Entry:  $70,200 (below trigger candle low)
Stop:   $70,700 (above resistance)
Target: $68,900 (next support)

Risk:   $500 | Reward: $1,300 | R:R = 1:2.6
Result: Bitcoin dropped to $68,800 over 4 hours ✓
Common Mistakes #
1. Using order flow in isolation Footprint charts confirm price action setups — they do not replace them. Always identify the key level first, then use order flow to confirm. A stacked imbalance at a random location is far less meaningful than one at a proven support zone.
2. Over-reading individual candle delta One candle with negative delta in an uptrend is not a reversal signal. Look for cumulative delta divergence across multiple candles, not a single data point.
3. Ignoring the location of imbalances within the candle Stacked buy imbalances at the TOP of a candle (near the high) are actually bearish — it means buyers exhausted themselves at the high. Stacked buy imbalances at the BOTTOM (near the low) are bullish — buyers absorbed the selling.
4. Misreading absorption as weakness When a bearish candle has positive delta, that is absorption — large buyers are buying into selling pressure. Most traders see a red candle and go short. The order flow reader goes long.
5. Not adjusting for platform differences Different platforms display footprint data differently (volume delta, tick delta, bid/ask delta). Make sure you understand what your specific platform is showing before trading on it.
6. Trading on low-volume candles A footprint with very low total volume (thin market, off-hours) will show extreme imbalances that mean nothing. Only apply order flow analysis during high-liquidity periods.
Order Flow Trading Checklist #
Before Using Order Flow to Enter #
- Is price at a key level identified by standard price action?
- Is the higher timeframe trend aligned with the trade direction?
- Is total volume on the footprint candle above the session average?
- Is delta confirming the expected direction?
Imbalance Quality Check #
- Are there 3+ consecutive imbalances in the same direction?
- Are the imbalances at the correct location (bottom for longs, top for shorts)?
- Is cumulative delta diverging from price (confirming exhaustion)?
Entry Execution #
- Entry: Above/below the imbalance candle extreme
- Stop: Beyond the outermost imbalance level
- Target: Next key level (minimum 1:2 R:R)
- Size: Reduce size if only 2 of 3 signals confirm
Final Thoughts #
Order flow and footprint charts are the closest retail traders can get to seeing institutional activity in real time. Most traders will never learn to read them — which means the ones who do have a genuine informational edge.
But the edge only works when you combine order flow with everything else:
- Market structure and trend direction
- Key price levels (support, resistance, demand/supply zones)
- Standard price action (candlestick patterns)
- Order flow confirmation (delta, imbalances, stacked levels)
Use order flow as your final confirmation. When the structure says buy, the level says buy, the candle says buy, and the footprint says buy — that is a trade worth taking.
Disclaimer #
This content is for educational purposes only. I am not a financial advisor. Trading involves substantial risk. Past setups do not guarantee future results. Always use proper risk management.