Table of Contents #
- What is Market Structure
- Swing Highs and Swing Lows
- Uptrend — Higher Highs and Higher Lows
- Downtrend — Lower Highs and Lower Lows
- Sideways / Range Market
- Break of Structure (BOS) & CHoCH
- Internal vs External Structure
- How to Trade Market Structure
- Multi-Timeframe Structure
- Real Trade Examples
- Common Mistakes
- Checklist
What is Market Structure #
Market structure is simply the pattern of highs and lows that price creates as it moves over time.
Every chart you will ever look at is made of the same building blocks:
- Swing Highs — peaks where price turned down
- Swing Lows — valleys where price turned up
By tracking whether each new swing high is higher or lower than the previous one — and whether each new swing low is higher or lower — you immediately know the trend.
This is not a complex concept. It is the oldest and most reliable form of technical analysis. Dow Theory identified these principles in the 1890s. Institutional traders use the same framework today.
The trend is your edge. Market structure tells you the trend.
Swing Highs and Swing Lows #
A swing high is a candle (or price bar) with lower highs on both its left and right sides. It is a peak — price moved up, stalled, and turned back down.
A swing low is a candle with higher lows on both its left and right sides. It is a valley — price moved down, stalled, and turned back up.
How to Identify Them #
Use the 3-candle rule as a minimum: a swing high needs at least one lower candle on each side. For higher timeframe analysis, use 5 or more candles on each side for more significant swings.
Swing High Example:
Candles:  97  |  102  |  108  |  105  |  100
                          ↑
                     Swing High (108) — lower candles on both sides

Swing Low Example:
Candles:  108  |  103  |  98  |  101  |  106
                          ↑
                      Swing Low (98) — higher candles on both sides
Why Swing Points Matter #
- They define where institutional orders were placed (reversals happened for a reason)
- They create the building blocks of trend analysis
- They mark the levels to watch for breaks and retests
- They anchor Fibonacci retracement and extension levels
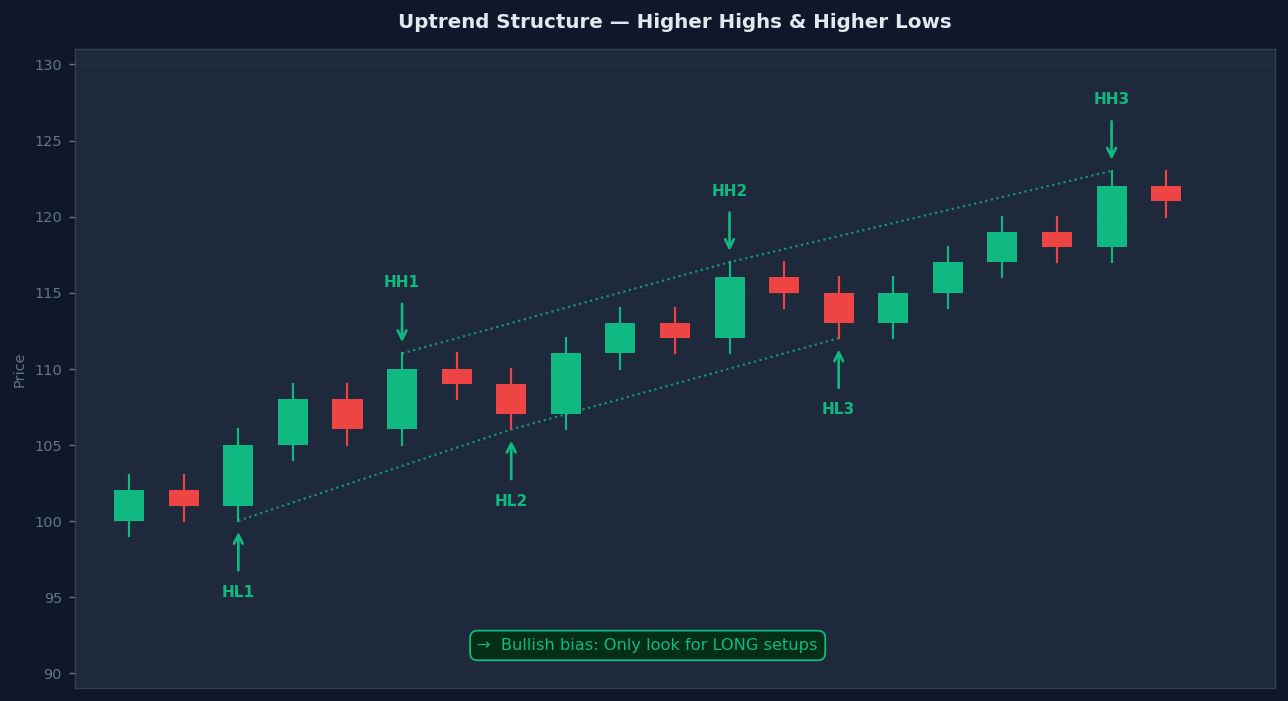
Uptrend — Higher Highs and Higher Lows #
An uptrend is defined by:
- Each swing high is higher than the previous swing high → Higher High (HH)
- Each swing low is higher than the previous swing low → Higher Low (HL)
This pattern tells you buyers are in control. Each time price pulls back, buyers step in at a higher level than before. Each time price rallies, it reaches a higher peak.
Trading Rule #
In an uptrend: only look for LONG setups.
The highest probability trade is buying the pullback to a Higher Low zone — joining the dominant institutional flow.
Uptrend Sequence:
Low 1 → High 1 → HL (higher than Low 1) → HH (higher than High 1) → HL → HH

Bitcoin Example:
$68,000 (Low 1) → $70,400 (High 1) → $68,800 (HL) → $71,200 (HH) → $69,500 (HL) → ...
Each pullback holds above the previous low → Structure is intact → Bias: LONG
How Long Does an Uptrend Last? #
The uptrend remains intact as long as price continues making Higher Highs and Higher Lows. The moment a Higher Low fails (price breaks below the previous HL), the structure begins to weaken.
Downtrend — Lower Highs and Lower Lows #
A downtrend is defined by:
- Each swing high is lower than the previous swing high → Lower High (LH)
- Each swing low is lower than the previous swing low → Lower Low (LL)
This tells you sellers are in control. Each rally fails at a lower level. Each sell-off pushes price to a new low.
Trading Rule #
In a downtrend: only look for SHORT setups.
The highest probability trade is shorting the rally to a Lower High zone — joining the dominant institutional selling flow.
Downtrend Sequence:
High 1 → Low 1 → LH (lower than High 1) → LL (lower than Low 1) → LH → LL

Bitcoin Example:
$68,000 (High 1) → $62,000 (Low 1) → $65,500 (LH) → $59,000 (LL) → $63,000 (LH) → ...
Each rally fails below the previous high → Structure is intact → Bias: SHORT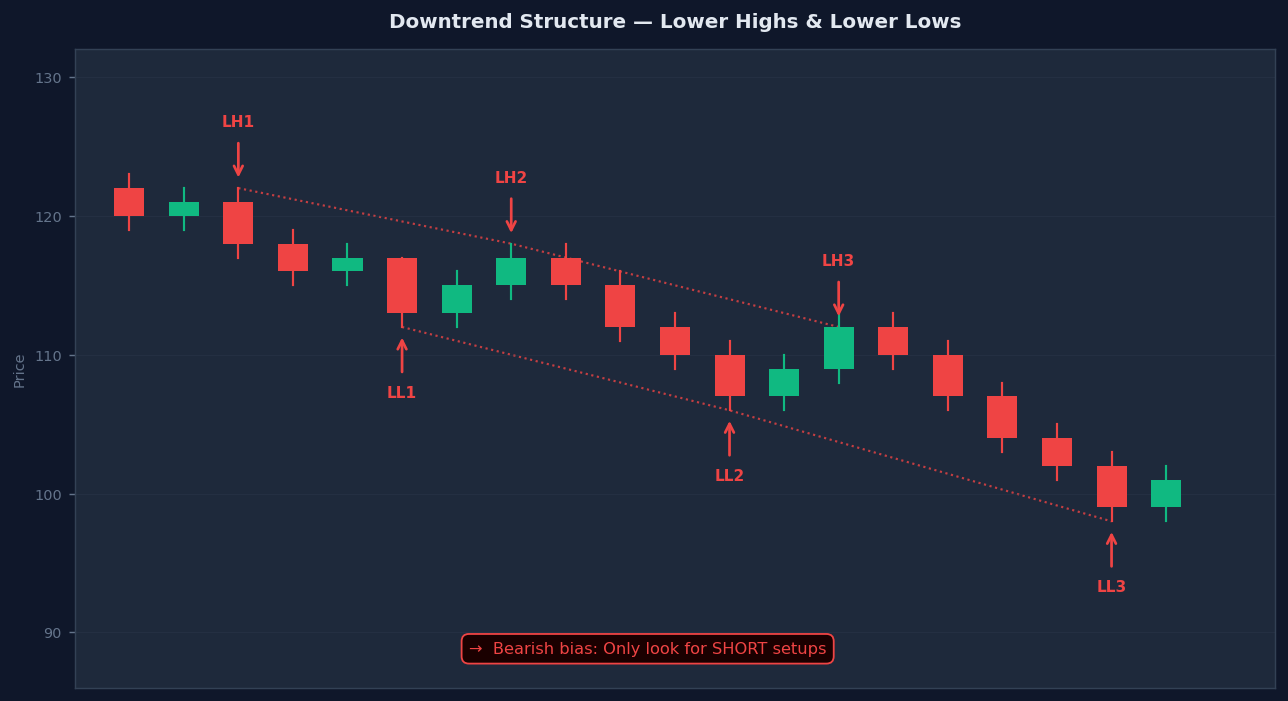
Sideways / Range Market #
When price is making equal highs and equal lows — not clearly trending either direction — the market is in a range or consolidation phase.
Characteristics of a Range #
- Price bounces between a clear top (range resistance) and a clear bottom (range support)
- Volume tends to be lower than during trending phases
- This often represents institutional accumulation or distribution
How to Trade a Range #
- Buy near the range support (bottom), target range resistance (top)
- Short near the range resistance (top), target range support (bottom)
- Wait for the breakout — the most powerful move is when price breaks out of range with strong volume
The Most Important Skill: Recognising Which Phase You Are In #
| Market Phase | Condition | Best Strategy |
|---|---|---|
| Uptrend | HH + HL pattern | Buy pullbacks to HL zones |
| Downtrend | LH + LL pattern | Short rallies to LH zones |
| Range | Equal highs + equal lows | Fade extremes or wait for breakout |
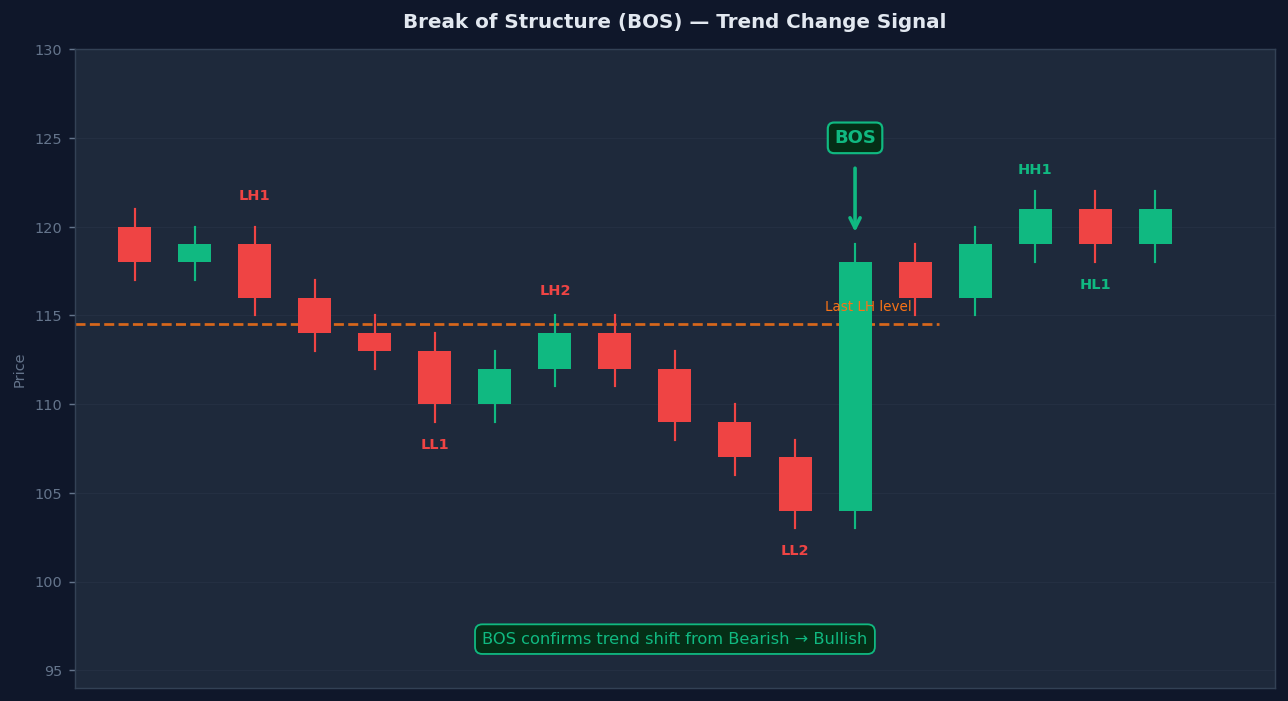
Break of Structure (BOS) #
A Break of Structure occurs when price moves beyond a key swing point that was previously holding as structure.
Bullish BOS #
In an uptrend: price breaks above the previous Higher High (trend continuation).
- Confirms buyers are still in control
- After a bullish BOS, expect the uptrend to continue with higher highs
- Look for pullback entries after the BOS
Bearish BOS #
In a downtrend: price breaks below the previous Lower Low (trend continuation).
- Confirms sellers are still in control
- After a bearish BOS, expect the downtrend to continue with lower lows
- Look for pullback short entries after the BOS
BOS Rules #
✓  The candle BODY must close beyond the structure level
✗  A wick alone does NOT confirm BOS
✓  Higher volume on the break = stronger signal
✓  Higher timeframe BOS is more significant than lower timeframe BOS
BOS vs CHoCH #
- BOS = trend continuation. Price breaks in the SAME direction as the existing trend (uptrend: price breaks above the previous HH; downtrend: price breaks below the previous LL).
- CHoCH = potential reversal. Price breaks AGAINST the existing trend for the first time (uptrend: price breaks below the most recent HL; downtrend: price breaks above the most recent LH). CHoCH is the first warning sign — BOS in the new direction confirms the reversal.
Internal vs External Structure #
Understanding two layers of structure gives you far more precision.
External Structure (Major Swings) #
The most obvious and significant swing highs and lows visible on your current timeframe. These are the large peaks and valleys that everyone can see. They define the primary trend direction.
Internal Structure (Minor Swings) #
Smaller swings that form inside the legs of external structure. These are the higher-timeframe pullback zones. Internal structure helps you time entries within the external trend.
Practical Application #
External structure (4H chart): Bitcoin in uptrend — HH at $68,000, HL at $63,000
Internal structure (15M chart): During the pullback from $68,000 to $63,000,
  there are multiple small LH and LL forming

→ Trade idea: When internal structure (15M) shows a BOS upward INSIDE the
  $63,000 HL zone (external 4H support), enter long
→ This is the highest-precision entry method
How to Trade Market Structure #
Step 1: Identify the Higher Timeframe Trend #
Start on the Daily or 4H chart. Is the market making HH+HL (uptrend) or LH+LL (downtrend)?
This gives you your directional bias — the only direction you will trade for the session.
Step 2: Mark the Key Structure Levels #
On the 4H/1H chart, mark:
- The last significant swing high (resistance in downtrend)
- The last significant swing low (support in uptrend)
- The most recent BOS level
Step 3: Wait for Price to Return to Structure #
In an uptrend, wait for price to pull back to the Higher Low zone. In a downtrend, wait for price to rally to the Lower High zone.
Step 4: Enter on Lower Timeframe Confirmation #
Drop to the 15M or 5M chart. Wait for the lower timeframe to show its own BOS in the direction of your trade. This is your entry trigger.
Step 5: Define Stop and Target #
- Stop loss: Beyond the structure level (below the HL in an uptrend, above the LH in a downtrend)
- Target: The next structure level in the trend direction (previous HH, or next expected swing)
Multi-Timeframe Market Structure #
| Timeframe | Role | What to Look For |
|---|---|---|
| Weekly / Monthly | Macro trend direction | Is the big picture bullish or bearish? |
| Daily | Primary trend | HH/HL or LH/LL pattern — your trading bias |
| 4-Hour | Intermediate structure | Key swing points, BOS levels |
| 1-Hour | Entry zone refinement | Smaller structure, point of interest |
| 15M / 5M | Entry trigger | LTF BOS or CHoCH for precise entry |
The Golden Rule #
Always trade in the direction of the higher timeframe structure.
A short setup on the 5M chart is low probability if the Daily chart is in a strong uptrend. Align all timeframes and your win rate improves dramatically.
Real Trade Examples #
Long Trade — Uptrend Higher Low Entry #
Market: Bitcoin 1H chart
Step 1 (Daily): Bitcoin making HH and HL on the daily → uptrend confirmed → bias LONG
Step 2 (1H): Last swing high (HH) at $71,200. Last swing low (HL) at $69,500.
Step 3: Price pulls back from $71,200 toward $69,500 (the HL zone)
Step 4 (15M): At $69,500, a small BOS upward forms on 15M (internal bullish structure)
Step 5: Enter long at $69,600

Entry:  $69,600
Stop:   $69,100 (below the 1H HL swing low — if this breaks, structure is invalid)
Target: $71,200 (previous HH) → potential to make new HH beyond that

Risk:   $500 | Reward: $1,600 | R:R = 1:3.2
Short Trade — Downtrend Lower High Entry #
Market: Bitcoin 4H chart
Step 1 (Daily): Bitcoin making LH and LL on daily → downtrend confirmed → bias SHORT
Step 2 (4H): Last LH at $65,500. Last LL at $61,000.
Step 3: Price rallies from $61,000 toward $65,500 (the LH zone)
Step 4 (1H): At $65,200, bearish BOS forms on 1H (price breaks below a recent 1H swing low)
Step 5: Enter short at $65,100

Entry:  $65,100
Stop:   $65,700 (above the LH zone — structure invalidated if broken)
Target: $61,000 (previous LL)

Risk:   $600 | Reward: $4,100 | R:R = 1:6.8
Common Mistakes #
1. Trying to trade every swing Not every swing high and low is a tradeable signal. Focus on the major, obvious swings that even a beginner would notice on the chart.
2. Ignoring the higher timeframe A bullish structure on the 5M chart inside a bearish structure on the Daily chart is a trap. Always know what the higher timeframe says.
3. Entering on BOS alone without confirmation A BOS is a structural event — it tells you the direction is shifting. But wait for a retest or lower timeframe confirmation before entering. Chasing the breakout candle directly leads to poor R:R entries.
4. Changing bias too quickly Markets can have multiple small BOS events during a consolidation. One small break does not change a major trend. Wait for the higher timeframe structure to clearly shift.
5. Drawing too many swing points Mark only the major, obvious swings. More swings = more confusion. If you need to zoom in very close to see a “swing,” it is not significant enough to trade.
Market Structure Checklist #
Before Any Trade #
- What is the Daily chart structure? (HH+HL / LH+LL / Range?)
- What is the 4H chart structure? Same direction as Daily?
- Is price approaching a key structure level (HL zone in uptrend / LH zone in downtrend)?
- Has there been a BOS in the trading direction on the entry timeframe?
Entry Conditions #
- Is the trade direction aligned with at least 2 higher timeframes?
- Is there a lower timeframe BOS or CHoCH confirming the setup?
- Is the stop placed logically beyond the key structure level?
- Does the trade offer at least 1:2 risk-reward to the next structure target?
Ongoing Management #
- If price breaks back through the key structure level → exit immediately
- Trail stop to protect profits as new HH/HLs (or LH/LLs) form
Final Thoughts #
Market structure is not optional knowledge. It is the operating system everything else runs on.
Before you apply VWAP, Volume Profile, demand zones, or any strategy — you need to know the structure. Without it, you are placing trades without understanding the environment.
Master these fundamentals in order:
- Identify swing highs and swing lows consistently
- Classify the trend: HH+HL, LH+LL, or range
- Identify BOS events and structural shifts
- Add higher timeframe context to every setup
Once market structure becomes automatic, your entire approach to the chart becomes clearer, calmer, and more profitable.
Disclaimer #
This content is for educational purposes only. I am not a financial advisor. Trading involves substantial risk. Past setups do not guarantee future results. Always use proper risk management.