Table of Contents #
- What is Fibonacci Retracement
- The Key Fibonacci Levels
- How to Draw Fibonacci Correctly (Step by Step)
- The Golden Zone — 0.618 to 0.786
- Trading the Retracement Levels
- Fibonacci Extension — Profit Targets
- Combining Fibonacci with Other Tools
- Real Trade Examples
- Common Mistakes
- Fibonacci Trading Checklist
What is Fibonacci Retracement #
Fibonacci retracement is a tool that identifies potential reversal zones within a pullback, based on the Fibonacci number sequence discovered by the Italian mathematician Leonardo Fibonacci in the 13th century.
The sequence: 0, 1, 1, 2, 3, 5, 8, 13, 21, 34, 55, 89, 144…
Each number divided by the next gives approximately 0.618 — the Golden Ratio, found throughout nature, architecture, and financial markets.
Why Fibonacci Works in Trading #
Large institutional participants — hedge funds, banks, prop desks — use Fibonacci levels as reference points for order placement. When millions of traders look at the same levels, it becomes a self-fulfilling prophecy: orders cluster at Fibonacci levels, causing price to react there.
Combined with structural key levels (support/resistance, demand zones, VWAP), Fibonacci levels become some of the most precise entry points available to any trader.
Fibonacci does not work everywhere. It works when drawn correctly between significant swing points, and when combined with other confluence factors.
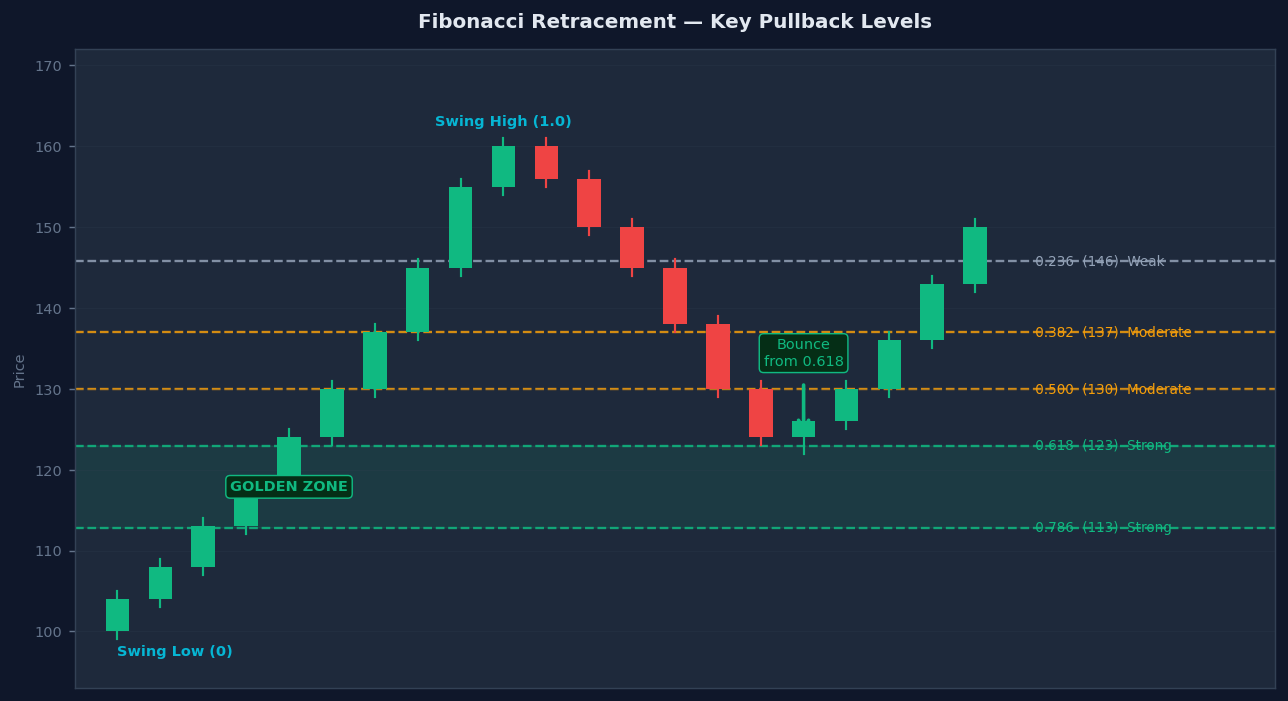
The Key Fibonacci Levels #
0.236 (23.6%) #
Weak retracement
Shallow pullback — market is very strong in the trend direction. Usually only holds in the most powerful trending moves. Low probability reversal zone alone.
0.382 (38.2%) #
Moderate retracement
Common pullback level. Markets in strong trends often bounce from here. Worth watching but needs strong confluence to trade.
0.500 (50%) #
Psychological level
Not a true Fibonacci number, but the 50% retracement is watched by almost every trader. Price respecting the 50% level signals the trend remains strong.
0.618 (61.8%) #
Golden Ratio — High Probability
The most important single Fibonacci level. The inverse of the Golden Ratio. Institutions place significant orders here. Strong confluence with other tools makes this a very high probability entry zone.
0.786 (78.6%) #
Deep retracement — still valid
The square root of 0.618. Represents a deep pullback that is still within the normal range of a healthy trend. Combined with 0.618, forms the Golden Zone.
0.886 (88.6%) #
Extreme retracement
Very deep pullback. Still technically valid but the trend is significantly weakened. Used in advanced SMC strategies (Optimal Trade Entry).
How to Draw Fibonacci Correctly — Step by Step #
The most common Fibonacci mistake is drawing it between random points. It must be drawn between significant, confirmed swing points for the levels to be meaningful.
Step 1: Identify a Clear, Completed Impulse Move #
Find a strong, directional move with a clear start (swing low) and end (swing high) — or vice versa.
The move should be:
- A significant impulse (not sideways chop)
- A completed move (price has already reversed from the swing point)
- Visible on at least the 1H or 4H chart for intraday/swing trading
Step 2: Draw from Swing Low to Swing High (for uptrend pullbacks) #
In TradingView:
- Select the Fibonacci Retracement tool
- Click on the Swing Low (the start of the impulse move)
- Drag to the Swing High (the end of the impulse move)
- Release — the levels are drawn automatically
Example — Bitcoin Upswing:
Swing Low:  $58,000 (click here first)
Swing High: $68,000 (drag here, release)

Fibonacci levels auto-placed:
0.236 → $65,640 (10% pullback from $68K)
0.382 → $64,180 (18% pullback)
0.500 → $63,000 (50% pullback)
0.618 → $61,820 (Golden Ratio level)
0.786 → $60,140 (deep pullback zone)
Step 3: Draw from Swing High to Swing Low (for downtrend pullbacks) #
In a downtrend, draw from the Swing High to the Swing Low. The levels then mark potential resistance zones where the pullback upward may stall.
Step 4: Watch for Confluence at the Levels #
The Fibonacci level itself is not the entry. It is the zone to watch. When price arrives at a key Fibonacci level AND you see:
- A candlestick reversal signal (pin bar, engulfing)
- A key support/resistance level aligning
- VWAP or Volume Profile POC nearby
…that is the entry trigger.
The Golden Zone — 0.618 to 0.786 #
The Golden Zone is the price range between the 0.618 and 0.786 Fibonacci levels. It is the single most powerful entry area in Fibonacci trading.
Why the Golden Zone is Special #
- 0.618 = the mathematical Golden Ratio, the most universally respected ratio in nature and markets
- 0.786 = the square root of 0.618, the next institutional level
- Together they form a zone of confluent institutional order placement
In a healthy uptrend, price pulling back into the 0.618–0.786 zone represents the last chance to enter before the trend resumes. This is exactly where institutions add to long positions — deep enough to shake out weak hands, but not deep enough to break the trend structure.
Golden Zone Rules #
Rule 1: The Golden Zone is a BUY ZONE in uptrends (0.618–0.786 of the upswing)
Rule 2: The Golden Zone is a SELL ZONE in downtrends (0.618–0.786 of the downswing retracement)
Rule 3: Always need a candlestick confirmation signal INSIDE the zone before entering
Rule 4: Stop goes BELOW 0.786 (if price breaks below, the trend structure is likely invalid)
Rule 5: Never enter on a limit order alone — wait for price action confirmation
Identifying the Golden Zone on Your Chart #
Upswing: Low = $68,000, High = $70,000 ($2,000 move)

0.618 of 2,000 = $1,236 → $70,000 - $1,236 = $68,764 (Golden Zone top)
0.786 of 2,000 = $1,572 → $70,000 - $1,572 = $68,428 (Golden Zone bottom)

Golden Zone: $68,428 – $68,764
Price pulling back into this zone + bullish pin bar = long entry
Stop: below $68,200 (below 0.786 + small buffer)
Target: $70,000 (swing high) and beyond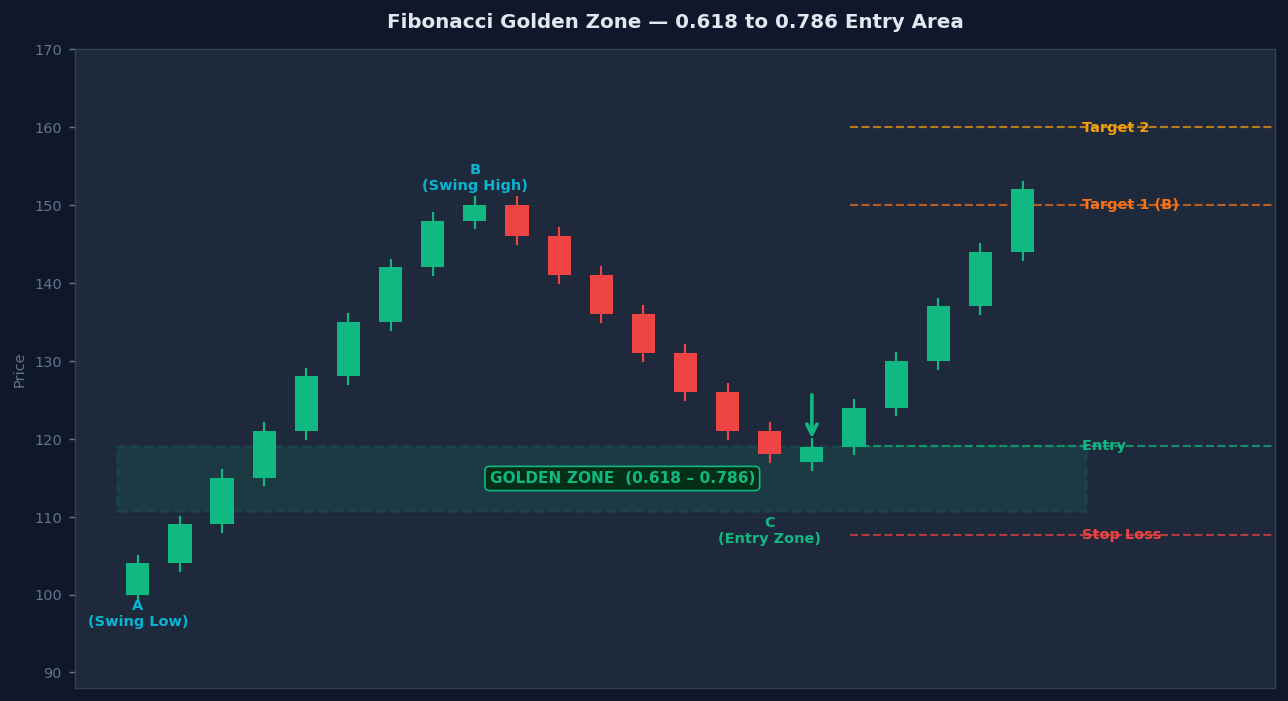
Trading the Retracement Levels #
Strategy 1 — Golden Zone Entry (Highest Probability) #
The core Fibonacci strategy. Trade the pullback to the Golden Zone in the direction of the established trend.
Setup Requirements:
- Clear, significant impulse move completed
- Higher timeframe trend aligned (uptrend for longs, downtrend for shorts)
- Price retracing into the 0.618–0.786 zone
- Candlestick reversal signal inside the zone (hammer, bullish engulfing)
Entry:
- On the break of the reversal candle’s high (for longs)
- Or on the next candle open after confirmation
Stop:
- Below the 0.786 level + small buffer (0.2–0.5% below)
- If price closes a full candle body below 0.786, the setup is likely invalid
Target:
- Target 1: The swing high (0 → 1.0 extension = 100%)
- Target 2: The 1.272 extension (beyond the swing high)
- Target 3: The 1.618 extension
Strategy 2 — 0.382 Entry (Strong Trend Only) #
In the most powerful trending markets, price barely pulls back to 0.382 before resuming. This is a shallower, quicker entry — higher reward but lower probability than the Golden Zone.
Use only when:
- The trend is exceptionally strong (3+ consecutive higher highs with no significant pullback)
- Volume was very high on the impulse move
- Price reached 0.382 AND showed a clear reversal signal
Risk: If the 0.382 breaks, the next major level is 0.618–0.786. Have a plan.
Fibonacci Extension — Profit Targets #
Fibonacci extensions project how far price may travel beyond the swing high after completing a pullback. They are used to set profit targets.
The Key Extension Levels #
| Extension Level | Target Type | Meaning |
|---|---|---|
| 1.0 (100%) | Target 1 | Return to the swing high — first natural target |
| 1.272 (127.2%) | Target 2 | First extension beyond the swing high |
| 1.618 (161.8%) | Target 3 | The Golden Ratio extension — most common final target |
| 2.0 (200%) | Target 4 | Extended move in very strong trends |
| 2.618 (261.8%) | Target 5 | Rare — only in explosive trend moves |
How to Draw Extensions in TradingView #
Use the Fibonacci Retracement tool but enable extension levels (1.272, 1.618, 2.0) in settings. Draw from swing low to swing high (same as retracement). The extension levels project forward beyond the swing high.
The ABC Extension Method #
The most reliable way to project targets:
A = Swing Low (start of impulse)
B = Swing High (end of impulse)
C = Pullback Low (end of retracement — ideally in Golden Zone)

Extension targets measured from A to B, projected from C:

Target 1: C + (B-A) × 1.0    → equal to original move
Target 2: C + (B-A) × 1.272  → 127.2% of original move
Target 3: C + (B-A) × 1.618  → 161.8% of original move

Example — Bitcoin:
A = $68,000 (swing low) | B = $70,000 (swing high) | Move = $2,000
C = $68,764 (pullback low, at 0.618 of the A→B move)

Target 1: $68,764 + ($2,000 × 1.0)   = $70,764
Target 2: $68,764 + ($2,000 × 1.272) = $71,308
Target 3: $68,764 + ($2,000 × 1.618) = $71,999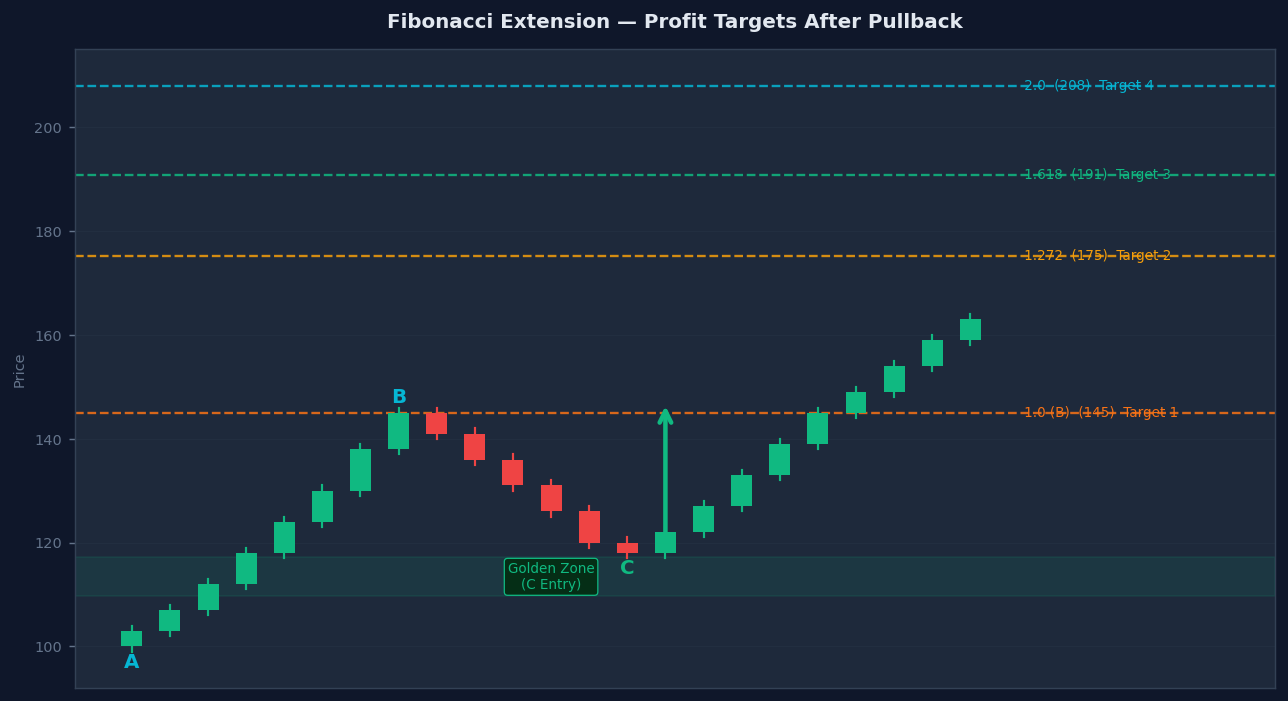
Combining Fibonacci with Other Tools #
Fibonacci levels alone are interesting. Fibonacci levels with multiple confirmations are powerful.
Fibonacci + Support/Resistance #
When a 0.618 level coincides with a prior swing low (now support), both retail and institutional traders are watching the same level. Two independent reasons for price to react = higher probability.
Fibonacci + VWAP #
If the Golden Zone aligns with the daily VWAP, institutions defending VWAP and Fibonacci buyers both act at the same price. Very high conviction long setup.
Fibonacci + Volume Profile POC #
A Fibonacci level coinciding with the POC from the Volume Profile = the most-traded price is also the Golden Ratio retracement. Extraordinarily strong confluence.
Fibonacci + Demand Zone #
When a demand zone (from a previous strong impulse) overlaps with the 0.618–0.786 zone, the probability of a reversal is very high. This is the classic “ICT OTE” (Optimal Trade Entry) setup used in Smart Money Concepts.
Maximum Confluence Example — Bitcoin:

Fibonacci Golden Zone: $68,428–$68,764
Previous demand zone: $68,300–$68,700 (DBR pattern, fresh zone)
Daily VWAP: $68,550
Volume Profile POC: $68,600

All four align between $68,300–$68,764 → Extremely high conviction long zone
Entry on bullish pin bar or engulfing inside this zone
Stop: $68,000 (below demand zone) | Target: $72,000 (1.618 extension)
Real Trade Examples #
Long — Golden Zone Entry (Bitcoin 4H) #
Context: Bitcoin in an uptrend on daily. Recent impulse from $58,000 to $66,500.
Fibonacci drawn: Low $58,000 → High $66,500 (move = $8,500)

Key levels:
0.382 → $66,500 - (8,500 × 0.382) = $63,253
0.500 → $66,500 - (8,500 × 0.500) = $62,250
0.618 → $66,500 - (8,500 × 0.618) = $61,247  ← Golden Zone top (shallower)
0.786 → $66,500 - (8,500 × 0.786) = $59,819  ← Golden Zone bottom (deeper)

Golden Zone: $59,819 – $61,247

Bitcoin pulls back from $66,500 to $60,850 (inside Golden Zone)
A hammer candle forms at $60,850 with a wick to $60,200

Entry:  $61,100 (above hammer high)
Stop:   $59,600 (below 0.786 level)
Target 1: $66,500 (swing high, 1.0 extension) → profit: $5,400
Target 2: $69,450 (1.272 extension)
Target 3: $72,900 (1.618 extension)

Result: Bitcoin rallied to $68,800 (T2 hit) ✓
R:R to Target 2: 1:5.6
Short — Golden Zone in Downtrend (Bitcoin 1H) #
Context: Bitcoin in downtrend on daily. Downswing from $72,000 to $68,800.
Fibonacci drawn from High $72,000 to Low $68,800 (move = $3,200)

In downtrend, we draw fib from HIGH to LOW, then look for resistance at 0.618–0.786 of the rally:
0.618 of 3,200 = $1,978 → $68,800 + $1,978 = $70,778 (Golden Zone bottom)
0.786 of 3,200 = $2,515 → $68,800 + $2,515 = $71,315 (Golden Zone top)

Golden Zone: $70,778 – $71,315

Bitcoin rallies from $68,800 to $71,000 (inside Golden Zone)
Bearish engulfing candle forms at $70,950

Entry:  $70,800 (below engulfing low)
Stop:   $71,500 (above 0.786 level)
Target 1: $68,800 (swing low, 1.0 extension down)
Target 2: $67,740 (1.272 extension below $68,800)

Risk: $700 | Reward to T1: $2,000 | R:R = 1:2.86
Result: Bitcoin dropped to $68,600 over next 3 sessions ✓
Common Mistakes #
1. Drawing Fibonacci between insignificant swing points The swing points must be major, obvious highs and lows — not minor noise. A Fibonacci drawn between a 30-minute wick and a random candle has no meaning. Use the most obvious impulse moves visible on at least the 1H or 4H chart.
2. Treating every Fibonacci level as a reversal point Price does not always bounce at 0.618. Sometimes it goes straight to 0.786. Sometimes it goes to 0.882. The Fibonacci level is a zone to watch, not a guaranteed reversal. Always need a candlestick confirmation.
3. Using Fibonacci in sideways/ranging markets Fibonacci is a TREND tool. It measures retracements within a trend. In a sideways, choppy, range-bound market, there is no clean impulse to draw from, and Fibonacci levels will be meaningless.
4. Ignoring the stop loss beyond 0.786 If you enter at 0.618 and price keeps dropping to 0.786, do not freeze. The plan was a stop below 0.786. If 0.786 breaks, the trend structure may be invalidated — respect the stop.
5. Stacking too many targets without taking partial profits If you have 3 Fibonacci extension targets, take partial profits at each level. Letting a winning trade fully reverse because you were waiting for T3 is a common and painful mistake.
6. Drawing Fibonacci in only one direction Always check: does the Fibonacci level align with a support/resistance level from the chart? If yes → high probability. If the Fibonacci level sits in completely empty space with no other confluence → lower probability.
Fibonacci Trading Checklist #
Before Drawing Fibonacci #
- Is there a clear, completed impulse move between two obvious swing points?
- Is the higher timeframe in a clear trend (not sideways)?
- Am I drawing from the correct direction (low→high for bullish, high→low for bearish)?
At the Golden Zone #
- Has price pulled back into the 0.618–0.786 range?
- Is there a candlestick reversal signal inside the zone?
- Is there additional confluence (S/R, VWAP, demand zone, Volume Profile POC)?
- Is the signal on a timeframe of 15M or higher?
Entry Execution #
- Entry triggered above/below the confirmation candle extreme
- Stop placed below 0.786 level + small buffer
- Target 1 set at the swing high (1.0)
- Target 2 at the 1.272 extension
- Target 3 at the 1.618 extension (optional, if trend is strong)
Final Thoughts #
Fibonacci is not magic — it is a tool that works because a sufficient number of market participants believe it works and act accordingly. That self-fulfilling aspect, combined with the genuine mathematical relationship between impulse moves and their retracements, makes it genuinely useful.
The Golden Zone (0.618–0.786) combined with a demand zone or key support level, confirmed by a strong candlestick pattern, aligned with the higher timeframe trend — this is one of the most consistently profitable setups in trading.
Master the fundamentals:
- Draw correctly between major swing points only
- Watch the Golden Zone first (0.618–0.786)
- Always need a candlestick confirmation
- Use extension levels (1.272, 1.618) for your profit targets
When you combine Fibonacci with market structure, support/resistance, and volume analysis, you will have a complete, institutional-grade entry framework.
Disclaimer #
This content is for educational purposes only. I am not a financial advisor. Trading involves substantial risk. Past setups do not guarantee future results. Always use proper risk management.